Personal Reflection:
If you are an educator, you've probably been using Pinterest for a few years. In fact, you probably found this post through Pinterest! I'm fairly certain I found this image on Pinterest, but possibly on one of my other regular "fun" sites such as 9gag.com. In an attempt to track down the original, I found this site. It is not where I got the image, but it is a nice connection to the world of CGI and more detail about the snow effects in Frozen!
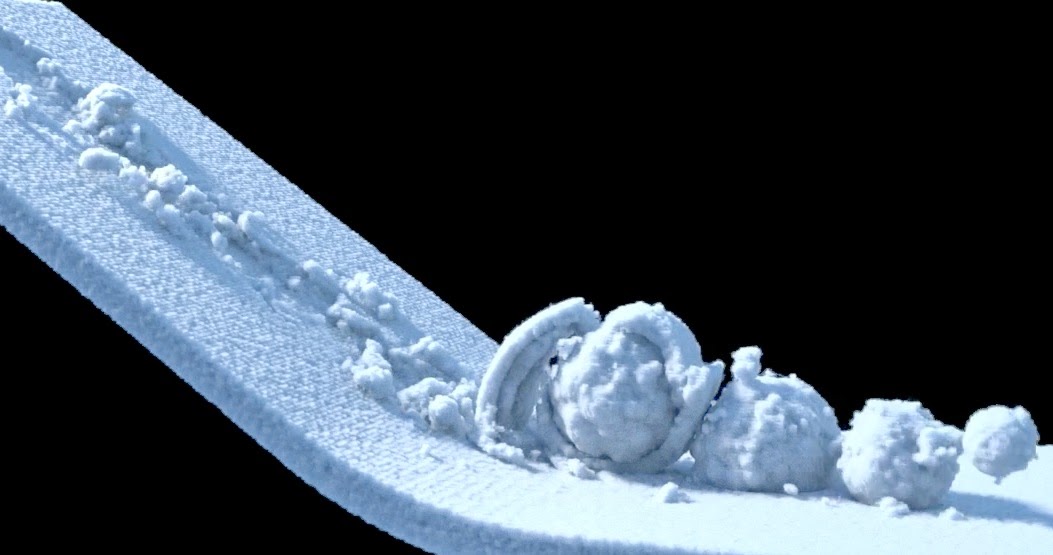
The site, linked above, has this amazing introduction,
"Snow is a challenging natural phenomenon to visually simulate. While the graphics community has previously considered accumulation and rendering of snow, animation of snow dynamics has not been fully addressed. Additionally, existing techniques for solids and fluids have difficulty producing convincing snow results. Specifically, wet or dense snow that has both solid- and fluid-like properties is difficult to handle. Consequently, this paper presents a novel snow simulation method utilizing a usercontrollable elasto-plastic constitutive model integrated with a hybrid Eulerian/Lagrangian Material Point Method. The method is continuum based and its hybrid nature allows us to use a regular Cartesian grid to automate treatment of self-collision and fracture. It also naturally allows us to derive a grid-based semi-implicit integration scheme that has conditioning independent of the number of Lagrangian particles. We demonstrate the power of our method with a variety of snow phenomena including complex character interactions."Wow. That's technical. In my own words? "Snow is hard to animate. While past methods worked fairly well, wet and dense snow was challenging because it acts like both a solid and a fluid. In order to address this, engineers created a model that uses two different geometrical methods to animate snow. They are able to use a Cartesian coordinate grid, along with programming, to simulate how snow both gathers (forms snowballs) and breaks (falls, hits, etc). This sounds SO advanced, but I believe the analysis is totally approachable by a typical middle school student. This is why I snagged the gif above and saved it, knowing that it would give some concrete meaning to students who are interested in the use of variables AND scientific notation!
Grade Level: 6-8
Course: Math, Pre-Algebra, Algebra
Standards: 6.EE.6, 6.EE.9, 7.EE.4, 8.EE.4
SMP: MP1, MP2, MP3, MP4, MP6, MP7, MP8
Skills: Variables, Algebraic Reasoning, Scientific Notation

How to use this as a mad minute:
You'll definitely need to preview this and explain the basics to the students. However, after a short intro, a 1 minute number sense and reasoning check in might look like:
Compare the top two expressions carefully. When you identify the difference in the expressions, and the subsequent snow fall, describe how you think the change in the scientific notation changes the snowfall.
How to use this as a warm up:
Again, after an intro, so students understand what this gift shows and where it comes from, I would challenge them to work with a partner to try to define what each "variable" controls, and how the change controls it. (Hint: It might be useful to name the snow fall quadrants A, B, C, and D in order to know which is which. I will use A in the upper left and rotate clockwise through.)
A sample answer might be, "The equations on the right have ThetaS of 7.5 x 10^-3 and the snow is noticeably more clumpy or less-liquid than those on the left." (There are several comparisons they could make, so don't stop! Also, I would recommend you DON'T provide this example to the students prior to them working and struggling, it will be more productive that way!
How to use this as a mini-lesson?
I would start the same way as above, but prepare extension questions for students. The exploration I outlined above, might only take 5 minutes, but a 20 minute mini-lesson could easily flow.
First, I would encourage students to share out, and convince others of their observations. This is a great way to work on descriptive language, choosing appropriate adjectives, and talking about scientific notation.
To push students further, I would ask them to try to create their own equation that merges some of the changes. Then challenge them to describe the resulting snowfall, and possibly even illustrate the final image.
How to use this as a full lesson?
Continuing on the trend above, I would then push students to explore more independently.
If your classroom has technology, I would visit the site: http://www.cgmeetup.net/home/making-of-disneys-frozen-snow-simulation/ and have the students watch the video. Another option would be for them to find a clip of the movie online and try to match which of the four quadrants a particular scene might be using.
This is another video of how artists used mathematics in creating the imagery in the movie Brave.
Depending on your focus, you may push students to analyze the scientific notation. How big are these numbers? What does that tell you about the size of the changes?
A great reading extension is this article from The New York Times about the Columbia University mathematicians who are working with film studios to enhance their computer graphics.
How to use this as an assessment?
I would not use this as an assessment, as it's probably a student's first exposure to this type of analysis. However, if you've provided similar learning experiences for students, the Warm Up lesson is probably an opportunity for authentic assessment and analysis.
Please feel free to use any of these ideas and modify them to meet your needs. However, please acknowledge the original source of the items and my own lesson outlines. ©NatalieRSprigg 2014
No comments:
Post a Comment