Showing posts with label Research. Show all posts

Saturday, September 5, 2015

Failure, Learning, and Progress

I'm a month in to the start of another school year.  This is my third year coaching and I am constantly amazed at how the same "ideas" come back to the forefront over and over again.  It is so easy to get stuck in the daily grind and to forget what amazing researchers and educators have told us about students and learning.

First, I want to attribute this image to the incredible blogger, author, artist, mathematician Jessica Hagey and her website thisisindexed.com.  She publishes a new "index card" weekday mornings that are incredible commentaries on the world around us.  I find so many of them are useful for instruction, analysis, sense making, and general life lessons.  Check her out, follow her, and see what you find!

Grade Level: ANY
SMP: MP1, MP2, MP3, MP4, MP5, MP6, MP7, MP8

So, you may ask, is this a lesson?  No.  It's not meant for kids, although I know my students could engage in a thoughtful discussion around the ideas.  This is meant for ME, for my teachers, for those I work with and coach, and for you, if you are anyone who has experienced failure and growth.

Why this?  Why now?
Just this week one of the incredible teachers I work with brought up the idea of feedback over grades.  She had just read an article that talked about never giving a grade, but constantly providing feedback. She was intrigued and wondered how it might work in her own class.

"Mindset" isn't just a buzzword in education today.  It's a buzzword in parenting, in coaching, in sports, and in business.  Carol Dweck, author of Mindset, is one of the major names in the field today, but is far from the only person pontificating on the power of positive thinking.  (If you haven't read the book, it's incredibly accessible, quick to read, and useful!)

Let's get down to it.  Here is an incredible resource to use if you are providing PD around feedback and mindset to teachers.  The MARS/Shell Centre has some really nice resources including one around feedback for students.  The research is clear:  providing students with feedback (instead of a grade or score) will increase the opportunity for students to reflect, revise, and improve.  A score is too permanent for students and decreases the chances that students will see their learning and performance as fluid and open to growth.

As I told my teacher, I can't imagine a classroom where EVERYTHING is open to revision and growth and I never award a final performance score (proficient, partially proficient, etc.).  However, I love the idea and the meaning behind it.  At least 4 times over the last two years I have provided written feedback to students regarding their thinking on assessments (in lieu of a score) and DID see an increased effort to respond to my feedback and revise, expand, or elaborate on their thinking.  This is an incredible tool for educators to use and I know I need to do quite a bit more of this in the future.

Not only that, but if we take a minute to reflect on the Standards of Mathematical Practice, think about how essential this idea of FEEDBACK is to helping your students become proficient in using the SMPs.  Of course, SMP 1 is obvious.  "Make sense of problems and persevere in solving them" is closely linked to providing feedback and opportunities for students to explore and improve their work.  However, what about the other SMPs?  SMP 2?  Reason abstractly and quantitatively?  Isn't this your chance to encourage your students to contextualize or decontextualize (as needed) in problem solving situations?  This is your chance to ask students to explore further, to apply numbers and symbols to their solutions, or to back off of specifics and begin to answer for generic cases.  SMP 3?  Construct viable arguments and critique the reasoning of others?  Your feedback could center around asking students to make a stronger argument for their answer, or to say, "I saw several students say the answer should be _____, what do you think?"  Your feedback and questions can push students to really work on their argumentation skills when it comes to mathematics. I could continue, but I think it is clear, FEEDBACK is an obvious solution to "How do I teach the SMPs?  How do I engage students in this kind of thinking and reasoning?"  

A "failing" grade doesn't lead to learning.  Progress occurs when failure and learning overlap, and I believe that the progress can only come from timely, specific, relevant feedback with a chance for students to try again.

If you are looking for more ideas around growth Mindset, let me know!  I've been gathering a lot of resources and have been using them with my 8th graders this year, and I think it is beginning to pay off!

Please feel free to use any of these ideas and modify them to meet your needs.  However, please acknowledge the original source of the items and my own lesson outlines.  ©NatalieRSprigg 2015


Sunday, June 23, 2013

Summer on Uranus

Personal Reflection:
This is another photo from uberhumor.com.  I find that this site, though not always student-appropriate, does have a mix of "items" that often lend themselves to discussion and exploration.

This is a pretty simple fact.  It is easy to research the accuracy of this fact and determine that if the orbit of Uranus around the sun is 84 years, then "summer" or 1/4 of that time, would be 21 years.  But to me, there's so much more to ask and so much more to explore.

This is also an ideal way to encourage students to use background knowledge to build a "case" for the accuracy of this fact and then confirm their answers electronically.

Note:  As a special addition below, I included some ideas for interdisciplinary connections!

Grade Level: Middle School 
Course: Pre-Algebra 
Standards:  Science:  5-8 Standard D, 9-12 Standard B  (Though math is involved, I don't think this relates to specific standards.) 
SMP: SMP.1, SMP.2, SMP.3, SMP.6, SMP.8

Skills: Critical thinking, research, questioning, Algebra, Computation


How to use this as a mad minute:
You have 60 seconds. Outline your immediate reaction to this and back it up with either scientific or mathematical knowledge.

How to use this as a warm up:
You could ask the students to consider one of the following:
1.  If "summer" on Uranus lasts 21 years, what do you know about it's period of rotation about the sun?
2.  Based on what you know about Uranus, what do you think "summer" looks and feels like?
3.  The Earth is tilted on its axis by 23º.  Uranus is tilted by 82º.  What does that tell you about seasons on the planet?
4.  The length of a day on Uranus is -0.718 Earth days.  What does the number tell you?  What does the negative mean?

How to use this as a mini-lesson:
Given 20 minutes, I would focus on discovery, exploration, and discussion.  For this mini lesson students will need access to the internet.
0:00--Let's look at this image!  (Show the graphic.)  Take a minute to think about it and discuss your immediate reaction with a friend.
1:00--What did you see or say to your partners?
2:00--Let's brainstorm.  What do you already know about seasons, Earth and Uranus?  Talk with a partner, write down everything you can think of, you have two minutes!
4:00--Partner up with another group and share your lists.  Add anything you don't have on your own.  Put a ? mark next to anything you are unsure about or disagree with.
5:00--Repeat combining two more groups.
6:00--Let's share out what you know!
8:00--Let's share items you were unsure of or to which you put a ? mark.  (Remember, you don't want them to ask, "Is this true?" just yet.  This is a valid question, but we are trying to build and confirm background knowledge.  Students WILL check out the validity of this number, but not quite yet.  Explain to them that they can answer this question shortly, but we are focusing more on things like, "Seasons are caused by the tilt of a planet on its axis." or "Uranus is tilted much more on its axis."  These are items that will help students answer the question on their own, eventually.)
9:00--You are going to have 3 minutes.  I want you to research anything you listed EXCEPT the length of summer on Uranus!  Make sure you find valid sites and make sure you document your sources!
12:00--Everyone had different questions.  Did everyone find their answers?  Were there any questions you were unable to answer?  Can anyone help them or tell them the answer?
14:00--Let's see if you can use your knowledge to answer the following questions.  I'm going to ask 2 questions and then give you and your team 3 minutes to answer them.   You should NOT use the Internet to answer.  1.  If summer is 21 years on Uranus, how long is a year?  2.  Does the length of summer (or a year) relate to how big Uranus is or how far away it is from the Sun? 
17:00--Confirm your answers using any resources you prefer!
19:00--So this simple graphic is TRUE!  Awesome!  What other questions would you like to explore now that you've seen this?

How to use this as a full lesson?
I really feel this is ideal for an EQUATE Lesson.  (Click link for explanation.)

I can see the students wanting to know if this is true, but that is far too simple and can be answered easily by Google.  It will require some fantastic questioning strategies from the teacher to guide students to more challenging or deep questions.  Off the top of my head, I would want to explore the following questions:
  • Which planet has the longest and shortest "summers"?
  • Which planet has the longest and shortest days?
  • Does the size of the planet relate to the length of the "summer" or "day"?
  • Do other planets have seasons like summer?  Why or why not?
  • What does "summer" look like on other planets?  (For example, Earth is tilted on its axis as it rotates, creating seasons, but other planets are not tilted or are tilted nearly 90 degrees, this causes great variation.  Also, gas planets don't heave "seasons" in the same way as others, and in some planets, though the temperatures vary, there's not what we would consider a season!)
Please note:  Some of my questions seem basic, but, as any good teacher knows, the depth is in the WHY? So don't forget to ask!

I found this site to be useful.  (NASA--Planetary Seasons)

How to use this as an assessment?
I don't feel this is appropriate for an assessment.  (You may feel otherwise and of course, feel free to use it!)

Interdisciplinary Connections
Ray Bradbury's short story "All Summer In A Day" is a great connection.  However, it can be a bit disturbing and you should definitely preview it before using it with students.

There is also a short (30 min) movie version of "All Summer In A Day"

I would definitely work with your team to, perhaps, have students read the story, watch the movie, research seasons on planets and, it's up to you, then assess their understanding.  My first thought is to separate students and hold a debate about how accurate the story/movie are, and whether or not this is a fair representation.  Students would need to back up their arguments with scientific evidence about the seasons on various planets as well as other items of "accuracy" such as life on another planet.


Please feel free to use any of these ideas and modify them to meet your needs.  However, please acknowledge the original source of the items and my own lesson outlines.  ©NatalieRSprigg 2013 

Thursday, June 13, 2013

Nobel/Chocolate Correlation?

Personal Reflection:
Just based on the last two posts, you'd probably think I love chocolate.  I don't!  I just find things that spark my interest and I save them. 

This image caught my eye because, off the bat, there seems to be a pretty strong correlation between chocolate consumption and Nobel Laureates.  I thought it would be fun to investigate!

This image can be found here.

Grade Level: High School

Course: Algebra, Algebra II, Prob/Stat

Standards:  S-ID.5, S-ID.6, S-ID.7, S-ID.8, S-ID.9, S-IC.2, S-IC.3, S-IC.6
SMP:  SMP.1, SMP.2, SMP.3, SMP.4

Skills: Algebra, Line of Best Fit, Correlation, Causation, Statistics, Problem Solving, Reasoning, Critical Thinking


How to use this as a mad minute:
You have 60 seconds. Explain what this graphic implies in 1 clear and specific sentence.

How to use this as a warm up:
You could ask the students to consider one of the following:
1.  Does this image have all of the essential elements of a clear graph?
2.  Do you think the use of flags and country names enhances or detracts from the image?  Why?
3.  Do you see a possible correlation?  Why or why not?  If so, what kind?
4.  What does the "r" value tell you about this graph?
5.  Which country consumes the most chocolate?  The least?  Which country has the most Nobel Laureates?  The least?

How to use this as a mini-lesson:
I'm disappointed that the data isn't available. I would love to have kids use their graphing calculators and a data table to generate equations of best fit.  I guess we just have to trust the info that is provided.  I did find the original article.  Linked here.

0:00--Take a look at this and then take a minute to discuss it with a partner.
2:00--What did you notice?  What stood out to you?
3:00--Do you think it is fair to make the argument "The more chocolate you eat, the more likely you are to win a Nobel Prize?"  (Feel free to adjust the statement to better match what your students say!)
5:00--Do you see any data that might be considered an outlier?  (If your students know the mathematical formula for outliers, feel free to apply it!  I would just discuss "in general" rather than doing it in that much detail.)
6:00--Do you see any correlation?  Where?  (Hopefully they can tell you they see it visually in the data points, but also that they recognize the "r" value in the image.)  What does that mean? 
7:00--What questions do you have about this data, the study, or the relationship?  (Have them partner up, list their questions and then gather them back together to share out.  Write their questions down.)
10:00--If we draw a line of best fit, what would it tell us?
11:00--What would the slope tell us?
12:00--Work with a partner to write the line of best fit.  (Give an enlarged copy of the image.)
17:00--What is the difference between correlation and causation?
18:00--Can you think of other things that might have a correlation with no causation?  (Here's a site that has some great examples!)
20:00--Do you think this is an example of correlation without causation?  Why or why not?

How to use this as a full lesson?
I would definitely start with the mini lesson.  The ending question is a great point for the students to explore further.

Below I have 4 links to information about this "Nobel vs. Chocolate" image, research, etc.  I would ask the students to break up, study the information and be prepared to come back and share the information with others.  (I would do a jigsaw.) 

http://www.huffingtonpost.com/2012/10/10/chocolate-consumption-nobel-prize_n_1956163.html

http://www.bbc.co.uk/news/magazine-20356613

http://jn.nutrition.org/content/early/2013/04/24/jn.113.174813.abstract  (Full text is available in pdf link on the left.)

http://www.thescienceforum.com/news/31697-correlation-causation-chocolate-nobel-prize.html


A video that explains the image and research:


After their jigsaw, I would ask students to form an opinion about the graphic.  I'm thinking something in the range of:
  • I think the research and data are accurate and logical.
  • I think the reasearch is accurate but the causation link is missing.
  • I think the research and data are inaccurate.
(Of course any other opinions are totally fine!)

I would then ask students to back up their answers with examples from the texts they read, their own background knowledge, correct mathematical vocabulary, etc.  I would ask them to do it in a 1 page poster.

 How to use this as an assessment?

See the lesson above, it includes an assessment tool.

Another option would be to simply give students the graphic on a test, as an activity, etc, and ask them to reflect on the image.  (I would provide a word bank or other guidance on the types of "reflection" you want them to do!  My word bank might include:  linear, correlation, causation, accuracy, misleading.)

Please feel free to use any of these ideas and modify them to meet your needs.  However, please acknowledge the original source of the items and my own lesson outlines.  ©NatalieRSprigg 2013 

Wednesday, June 5, 2013

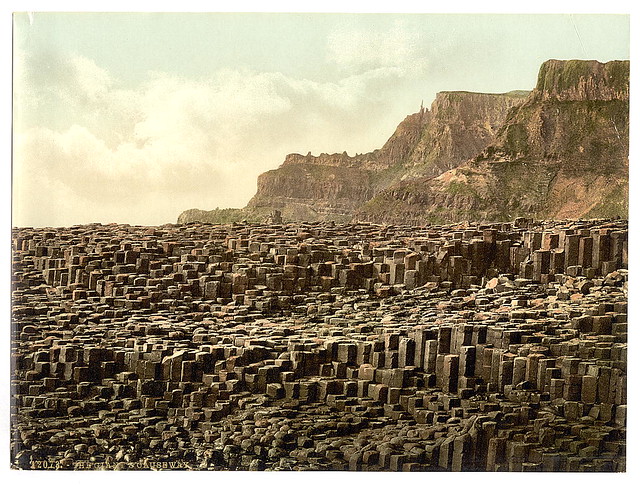
Giant's Causeway

Personal Reflection:

One of my most favorite places in the whole world (that I've never actually been to) is The Giant's Causeway in northern Ireland.

The summer after college I was a nanny for my cousins in a small town outside of Dublin called Dunboyne.  I was too young to get my Irish driver's license and ended up taking the kids to the city on the bus.  We did get to take weekend trips with the family to southern Ireland, but while I was there there was just too much unrest to visit up North.

Thus, this is the most amazing place in the world that I've always wanted to go to, but never have.  :)

The Giant's Causeway is a natural formation of rocks on the northern coast between Ireland and Scotland.  As you can see from the photos, these spires of rock form beautiful polygons, often hexagons, but reports are anything from quadrilaterals to nonagons. 

This, to me, is full of opportunities for great instruction.  I can see anything from estimation and basic polygon identification (3rd Grade) to tessellations and transformations. 

For this reason, I feel the EQUATE model is a perfect opportunity to explore these photos and this location.  Rather than focusing on a single grade, I encourage you to use the EQUATE thinking routine to apply appropriate standards at your grade level.

Grade Level: 3-HS

Course: Math, Pre-Alg, Algebra, Geometry

Standards:  3.MD.8, 3.G.1, 3.G.2, 4.MD.5, 4.G.1, 4.G.2, 4.G.3, 5.MD.5, 5.G.3, 5.G.4, 6.G.1, 6.G.2, 6.G.3, 6.G.4, 7.EE.3, 7.EE.4, 7.G.1, 7.G.6, 8.G.1, 8.G.2, 8.G.3, 8.G.4, G-CO.1, G-CO.2, G-CO.5, G-CO.6, G-CO.7, G-GPE.7, G-GMD.2, G-GMD.3, G-MD.1, G-MD.3
SMP: MP.1, MP.2, MP.3, MP.4, MP.5, MP.6, MP.7, MP.8
Skills: Estimation, Number sense, reasoning, modeling, geometry, geometric shapes, properties of shapes, area, perimeter, volume.


How to use this as a mad minute:
You have 60 seconds. Name all of the shapes you can see.

How to use this as a warm up:
You could ask the students to consider one of the following:
1.  Name the shapes you see.
2.  Does this fit the definition of a tessellation? Why or why not?
3.  Are these "regular" polygons?  Why or why not?

How to use this as a mini-lesson:
If I only had 20 minutes, I would use technology to explore this VERY COOL region.  This website has an awesome interactive map, some history, and the legend of the Giant's Causeway.

http://www.voicesfromthedawn.com/the-giants-causeway/

How to use this as a full lesson?
As I mentioned before, I feel that this is an ideal EQUATE lesson.  Although there is a ton of math that is obvious to an instructor, this captivates my interest because of the combination of legend, scientific history, and visual appeal.  I feel your students will also be drawn to these elements.  If you are comfortable, let the students dictate the direction of the lesson and exploration (within reason).

I would show these photos, let the students explore, discuss, etc.
Then I would list all of their questions, encouraging them to "wonder mathematically" about them.
Focused on grade-level appropriate standards, I would ask students to narrow down the questions to make sure they are relevant to things you have already explored or discussed in your class.
I would let the students ask YOU questions and you can provide the answers you feel are appropriate.  (How are they formed?  How big is the region?  How many are there?  You can provide as much or as little information as you wish.)
I would settle on a question (or two or three) for your students to apply their knowledge and continue to try to solve.  Encourage them to TRY something!  Draw on the photo, measure it, get online and do research, look up formulas that might be useful, gather information, start playing with the numbers, rules, formulas, photos, etc.
Finally, ask the students to Explain what they did, what they found, and how they approached the problem.

 How to use this as an assessment?
It is up to you if you think your students can use this as an assessment appropriately.

It could be something as simple as providing the first photo and asking students to outline as many different shapes as they can see and explain why they are different and what they are (Elementary School).

It could be more advanced, offering the size of the region, the size of an individual "step" and asking the students to estimate how many are in the entire region.  (Upper Elementary to Middle School.)

You could ask the students to find two similar "steps" and justify why they are similar (Middle/High).

You could ask the students to find the volume of two or three different "steps" and justify their solution methods.  (Middle/High).

You could ask the students to PROVE that two items are congruent or similar based on transformations such as rotations, reflections, etc.

Works Cited:
Photo 1
Description: Giant's Causeway and Causeway Coast
Copyright: © Philippe Croo
Author: Philippe Croo
Image Source: Philippe Croo  (Link)

Photo 2
http://farm3.staticflickr.com/2755/4427445338_7869405855_z.jpg?zz=1

Photo 3
https://garystravel.wordpress.com/page/107/


Please feel free to use any of these ideas and modify them to meet your needs.  However, please acknowledge the original source of the items and my own lesson outlines.  ©NatalieRSprigg 2013 

Friday, May 31, 2013

Wonder of Pi


Personal Reflection:

I saw this on 9gag.com and being a numbers nerd (proudly!), I saved it.  I wasn't immediately sure how I would use it.  It's a great way to show the concept of an irrational number never ending. (By the way, could we give a few other numbers credit the same way we give π credit?)  It's also a great way to show the concept of infinity.  We could use this in a geometry unit anywhere from 4th to 10th grades.  And yet, when I thought about it, I decided I'd most love to use this in a probability exploration.    Thus, the activities below are targeted at 7th grade (6th and 8th are statistics years, FYI) and at the high school level.  I will try to put appropriate 7th grade explorations in RED print and high school explorations will be in BLUE print.

Grade Level: 7th & HS

Course: Pre-Algebra, Algebra, Geometry, Prob/Stat

Standards:  7.SP.5, 7.SP.6, 7.SP.7, S-CP.2, S-CP.5, S-CP.6, S-CP.7, S-CP.8, S-CP.9, S-MD.6, S-MD.7
SMP: MP2, MP3, MP4, MP5, MP6, MP7, MP8
Skills: Compound Probability, basic probability, rounding, research, science, decision making, conditional probability, independent probability, frequency table, sample space, probability modeling, data collection


How to use this as a mad minute:
You have 60 seconds. Look at this image.  What are your immediate reactions, thoughts, concerns, celebrations, etc?

How to use this as a warm up:
You could ask the students to consider one or more of the following:
1.  List everything you know about π.
2.  What is the difference between an irrational number and a repeating decimal?
3.  What is the probability of randomly selecting the digit 3 from a set of digits 0-9?  What is the probability of selecting the digit 1 from a set of digits 0-9?  Are the probabilities equal?  Why?
4.  What is the probability of randomly selecting the digit 3, replacing it, and then selecting the digit 1 from a set of digits 0-9?  Is this more or less likely than selecting each number independently?  Why?
5.  What is the probability of randomly selecting the digit 3, replacing it, and then selecting the digit 1, replacing it, and then selecting the digit 4 from a set of digits 0-9?  Is this more or less likely than selecting each digit independently?  Why?

How to use this as a mini-lesson:
As a 7th grade exploration.
Assuming you have 20 minutes with 7th graders who have NO background in compound probabilities, here we go!

0:00--Today we are going to talk about probability.  We only have a short time, so let's agree that we are going to talk about "FAIR" probabilities, no trick coins, spinners, dice, etc.  Given that, what's the probability that when you roll a die, you get a 3?  (Allow for discussion, calling out, etc.)
1:00--Ok, so I heard answers as __________ (fractions?  decimals?  Percents?  All three?  This is where your fantastic impromptu skills come in.  I would guess that students will use a fraction more than any other, mostly because the decimal and percent equivalents are not obvious or easy for them to manage mentally.)  The probability of an event occurring is 

(from mathisfun.com)
So fractions are pretty easy to use when you know the number of 3s on a die and the total possibilities.  Do you all know that you can also write probabilities as decimals and percents?  (Get feedback, determine if you need to use another minute to discuss converting to decimals and percents.)
2:00--Awesome!  Let's do a few more probabilities.  This time I want you to try answering as fractions, decimals AND percents.  Switch it up!  
What's the probability of flipping a coin and getting heads?
What's the probability of being born a girl?
What's the probability of grabbing a marker out of my hand and getting red?  (Hold out 4 markers of different colors.)
(Listen to responses and address accurate and inaccurate answers as well as any concerns or creative answers you need to discuss!  Add your own if you need to, based on what you have around your room.)
3:00--What's the probability of selecting a letter from my last name and it being a ____?  (Using SPRIGG as an example, I'd ask first about the S, the P, the R, the I, and then, the G.  Most answers will be in fractions, depending on how many letters your last name has, which is fine!)
4:00--Let's talk about the possibilities of COMPOUND probabilities.  This is when I ask you something more complicated, like, "Whats the chance I roll a 3 AND flip a coin and get heads?"  Take a moment and write down your guess.  What do you think the chances are that when I flip this coin and roll a die, I get a 3 and Heads?  
5:00--How are we going to figure this out?  We already know the chance of getting a 3 is 1/6 and the chance of getting a heads is 1/2.  So what next?  (Allow for discussion.  Some students may already have learned this, which is a great stepping stone.  List their ideas.  Refer them back to the probability definition above.)
7:00--If we want to know the probability, we need to know the number of outcomes.  Does anyone have a suggestion of how we can figure out the number of outcomes?  
8:00--Ok, grab a partner and you have 2 minutes to try to list all of the outcomes that can happen if I flip a coin and roll a die. (While kids work, write the combinations down.  You can put it on a projector, your dry erase board, on a sheet of paper for a doc cam, etc.  Basically, you don't want to waste time doing it in front of them.  However, you might want to show different strategies, such as a tree diagram, organized lists, etc.)
10:00--How many different outcomes did you find?  (Get feedback. If answers are all over the place, you are going to need an additional one or two minutes for this lesson.  If the answers are very divergent, ask groups to partner with a group whose answer is FAR from theirs and discuss and compare.  Hopefully they will help each other see the best answer (12)!  If they are close to 12, but maybe missed one or two combinations, continue.)  How did you come up with those?
11:00--I did the same thing!  (Show your work.)  I got 12 combinations.  What do you think?  How many of those are combinations that show a 3 and a heads?
12:00--So, 1/12.  We already knew 1/6 and 1/2 for each.  What happened?  Do you think this will happen every time?  Should we try a different experiment?
13:00--What's the chance that I reach into a bag that has every letter in it, and I draw out an "H"?  What about if I replace it and try again.  What's the chance of drawing out an "I"?  Do you want to make these lists?  Can we figure out the probability without making the list?
15:00--Yes, it's 1/676.  I have a 1/676 chance (.15%) chance of randomly making the word "HI" when I draw the letters.  
17:00--Look at this graphic.  read it carefully.  Think about it for a minute on your own.  (Show the π image.)
18:00--Talk about it with your friend.  Based on what you just observed about probability, do you think this graphic is true?  Why or why not?
19:00--It's a fascinating proposal!  If you are interested, this will be on my website so you can investigate further.  I also recommend researching the "Infinite Monkey Theorem" to help you understand what this image is suggesting as well as the probability of it happening.  (Note:  Teachers, the first GOOGLE link to infinite monkey theorem is to the winery.  You may want to offer your own links on your website to avoid any issues.) 


As a 10th grade exploration.
Assuming you have 20 minutes with 10th graders (Any level of high school, really) who have background in compound probabilities, and need a refresher before you jump in, here we go!

0:00--Today we are going to talk about probability.  We only have a short time, so let's agree that we are going to talk about "FAIR" probabilities, no trick coins, spinners, dice, etc.  Given that, what's the probability that when you roll a die, you get a 3?  (Allow for discussion, calling out, etc.)
1:00--Ok, so I heard 1/6 (I hope!)  The probability of an event occurring is 

(from mathisfun.com)
These are independent probabilities.  If you look at the probability of a single even occurring, you can find it by looking at the number of positive outcomes divided by the number of total outcomes.
2:00--What's the probability of selecting a letter from my last name and it being a ____?  (Using SPRIGG as an example, I'd ask first about the S, the P, the R, the I, and then, the G.  Most answers will be in fractions, depending on how many letters your last name has, which is fine!) 
3:00--Let's talk about the possibilities of COMPOUND probabilities.  This is when I ask you something more complicated, like, "Whats the chance I roll a 3 AND flip a coin and get heads?" How many of you have done this in the past?  Do you remember how to do it?  (Discuss and do a quick review.)
5:00--Usually, in lower grades, you list the total outcomes.  You might make a tree diagram, a table, a list, etc.  But you already learned a trick to bypass this step.  It's important, though, to make sure that you are finding all possible combinations.  In high school you are asked to show probability distributions.  This proves that you've accounted for all possible outcomes.  Let's start with something simple.  List the outcomes I can get if I flip a coin twice.
7:00--Great, you should have gotten HH, HT, TH, TT.  Quick question.  Are HT and TH different results?  Should we count them as two different outcomes?  Why?
8:00--Ok, great.  4 outcomes.  Now you can make a probability distribution.  You start with a question.  "If I flip a coin twice, what is the chance I get heads?"  You want to start with a table that shows the possible outcomes and probabilities. 


9:00--Next, you translate that into a graph.  Often the graphs are "curves" but can also be bar graphs.


                                                                                                      (Image obtained here)
10:00--What questions do you have?
11:00--Let's look at another one.  This is based off of 10 coin flips.
                                                                     (Image located here)

12:00--Let's talk about this.  Why do you think the graph looks like this?  Is this common?  Can you compute, by hand, how many times you'd get only 1 head?  We'll come back to probability distributions later.
13:00--Ok, let's change directions.  What's the chance that I reach into a bag that has every letter in it, and I draw out an "H"?  What about if I replace it and try again.  What's the chance of drawing out an "I"?  Do you want to make these lists?  Can we figure out the probability without making the list?
14:00--Yes, it's 1/676.  I have a 1/676 chance (.15%) chance of randomly making the word "HI" when I draw the letters.  
15:00--Look at this graphic.  Read it carefully.  Think about it for a minute on your own.  (Show the π image.)
16:00--Talk about it with your friend.  Based on what you just observed about probability, do you think this graphic is true?  Why or why not?
18:00--It's a fascinating proposal!  If you are interested, this will be on my website so you can investigate further.  I also recommend researching the "Infinite Monkey Theorem" to help you understand what this image is suggesting as well as the probability of it happening.  (Note:  Teachers, the first GOOGLE link to infinite monkey theorem is to the winery.  You may want to offer your own links on your website to avoid any issues.  This is wikipedia, but has a good, basic intro to The Infinite Monkey Theorem.)  

How to use this as a full lesson?
I'd start a full lesson exactly as I did above.  I wouldn't feel the need to rush the kids and their answers or their work, though.  So this may take more than 20 minutes.

 As a 7th grade exploration.
Starting where we left off, with the "proposal" that all of "everything" can be found in π.

I'd print a page of the first ____ digits of π for the students.  I'd give each student a sheet and ask them to get a marker or highlighter.  I'd ask them to see if they could find the following sequences in the first ____ digits of π.
  • The two digit month they were born.
  • The two digit day they were born.
  • The two digit ending of the year they were born. 
  • The six digit birthdate made up of the month, day and year they were born.  Ex:  July 4, 1996 would be:  070496.
  • Their age.
  • Their height in inches.
  • Their height in centimeters.
This could take a VERY VERY long time.  Don't let it.  If they want to keep searching, let them do it at lunch, at home, etc.  Give them 10 minutes to explore.  Make a big deal out of it when kids find one!

Ask the kids to trade markers.  (A new color would be helpful.)  Then explain what ASCII is.  ASCII is an acronym for the American Standard Code for Information Interchange.  It is a set of digital codes widely used as a standard format in the transfer of text.  (google def.)  In other words, computers only talk in numbers, not in letters.  So ASCII is a programming language that translates letters and symbols to numeric codes.  Here's a conversion table:
 In this way, we can translate any word into strings of digits.  For example:
Sprigg:
S = 83
p = 112
r = 114
i = 105
g = 103
g = 103

So Sprigg could be translated to 83112114105103103  (Note: This is not entirely accurate, as coding systems need a way to know the difference between 83 and 831.)
However, I can now search π to see if this string of digits appear.   (It didn't appear in the first million digits.)  I did this by going to http://www.piday.org/million/ and then opening the find tool bar, and typing in my string of digits. 
 
I tried something easier, my nickname, Nat.  7897116 (Nope.)
I tried something easier, hi, as we explored before.  104105 (Nope.)

I was concerned that this wasn't working and tried pasting the digits in a word document to do the search.  Nope.  I checked by searching for a string I could see.  It was found.  So this method will work!  It was on page 6 before it found my 4 digit code of my birthday month and day.  

I really like this, even the failure part, because it illustrates to kids how difficult this probability will be.  If the translation to ASCII of "hi" can't be found in the first 9 pages of digits of π, what's the chance it will find, "the name of every person you will love, the date, the time" etc.?

I'd return to discuss the probability of this happening.

Then I'd throw out the Infinite Monkey Theorem (which I'm 99% certain inspired this graphic).  Ask the kids to discuss their thoughts and reactions to the theorem.  

Then share with them this quote, "The relevance of the theory is questionable—the probability of a monkey exactly typing a complete work such as Shakespeare's Hamlet is so tiny that the chance of it occurring during a period of time even a hundred thousand orders of magnitude longer than the age of the universe is extremely low (but not zero)."  (From wikipedia.)  

If that doesn't give all of us some perspective on the concept of infinity, not much will!

As a 10th grade exploration.
I would do the lesson outlined above, with a few changes.  
First, I'd still address the probability distribution in the mini lesson.  I'd continue from the mini lesson.  Rather than print pages of π, I'd get the kids to use technology.  Just as I outlined above, if they go to http://www.piday.org/million/ and search for the following sequences.
 

I'd ask them to see if they could find the following sequences in the first ____ digits of π.
  • The two digit month they were born.
  • The two digit day they were born.
  • The two digit ending of the year they were born. 
  • The six digit birthdate made up of the month, day and year they were born.  Ex:  July 4, 1996 would be:  070496.
  • Their age.
  • Their height in inches.
  • Their height in centimeters.
Give them 10 minutes to explore.  Make a big deal out of it when kids find one!  Let them try anything they want.  They may not find anything.  I'd try ages, shoe sizes, a combination of siblings' ages, etc. 

Given the image, the kids need to know what ASCII is.  Give them 3 or 4 minutes to use technology to search for what ASCII is and to find some examples.   (Info is above if you need it.)

Definitely take a minute to review their findings and clarify with them!

I'd then ask the kids to use the table above, or any tool they found in their research to translate their name to ASCII characters.  In this way, we can translate any word into strings of digits.  For example:
Sprigg:
S = 83
p = 112
r = 114
i = 105
g = 103
g = 103

So Sprigg could be translated to 83112114105103103  (Note: This is not entirely accurate, as coding systems need a way to know the difference between 83 and 831.)
However, students can now search π to see if this string of digits appear.   (It didn't appear in the first million digits.) 
 
I tried something easier, my nickname, Nat.  7897116 (Nope.)
I tried something easier, hi, as we explored before.  104105 (Nope.)

I was concerned that this wasn't working and tried pasting the digits in a word document to do the search.  Nope.  I checked by searching for a string I could see.  It was found.  So this method will work!  It was on page 6 before it found my 4 digit code of my birthday month and day.  

I really like this, even the failure part, because it illustrates to kids how difficult this probability will be.  If the translation to ASCII of "hi" can't be found in the first 9 pages of digits of π, what's the chance it will find, "the name of every person you will love, the date, the time" etc.?

I'd return to discuss the probability of this happening.

Then I'd throw out the Infinite Monkey Theorem (which I'm 99% certain inspired this graphic).  Ask the kids to discuss their thoughts and reactions to the theorem.  

Then share with them this quote, "The relevance of the theory is questionable—the probability of a monkey exactly typing a complete work such as Shakespeare's Hamlet is so tiny that the chance of it occurring during a period of time even a hundred thousand orders of magnitude longer than the age of the universe is extremely low (but not zero)."  (From wikipedia.)  

Ask your high school students to simply calculate the probability of the string of digits to form "hi" appearing in a row.  (104105)  That's 10^6 combinations!  1/1,000,000 chance!  Of course it doesn't appear in the first 1 million digits!  But what if those digits went on forever?   


How to use this as an assessment?

I don't feel that this is an appropriate assessment tool.  However, if you have just finished an in-depth exploration of probability at the high school level, you could definitely ask your students to respond to the graphic and back up their responses with mathematical thinking and research.  That would, to me, be a big project, and a take-home assignment at the very least!


Please feel free to use any of these ideas and modify them to meet your needs.  However, please acknowledge the original source of the items and my own lesson outlines.  ©NatalieRSprigg 2013