Showing posts with label Geometry. Show all posts

Wednesday, June 12, 2013

Infinite Chocolate

Personal Reflection:

This was one of the first images I've seen in a long time that inspired me to actually investigate and try to explain what was happening.  I didn't just try to use logic, reason, estimation, etc.  I actually got out graph paper, scissors, tape and MADE a paper chocolate bar.  If it can inspire me to build and play, I'm sure it will do the same for students.

I got this gif from this site.

Grade Level: 7-10

Course: Algebra

Standards: 7.G.1, 7.G.4, 7.G.6,G-CO.6, G-CO.7, G-CO.12, G-MG.1, G-MG.3
SMP:  SMP.1, SMP.2, SMP.3, SMP.4, SMP.5, SMP.6

Skills: Geometry, Area, Constructions, Modeling, Problem Solving, Ratio, Proportion, Scale

How to use this as a mad minute:
You have 60 seconds. Give me one reason you think this DOES or does NOT work.

How to use this as a warm up:
You could ask the students to consider one of the following:
1.  What is the area of the original chocolate bar in generic "units"?
2.  What is the area of the new chocolate bar in generic "units"?
3.  When the candy bar is broken up, there are 5 pieces.  Describe each piece using a correct geometric name and explain what properties each piece has to categorize them.
4.  Draw the 5 pieces on your paper (sketch!) and then label the angles.  (Acute, obtuse, right, straight.)
5.  What is the perimeter of the original candy bar?  Is the final perimeter the same or different?

How to use this as a mini-lesson:
Please note:  I included screen shots of the candy bar when it isn't moving for YOU to use, but largely, it would take away some mystery for the kids, so I probably would NOT show the photos to them.


0:00  Look at this awesome gif!  Have you seen this online?  If so, what did you think?  Watch and then turn and discuss with a partner.
1:00  If you haven't already discussed with a partner, focus on whether or not you think this works and why.
2:00  Ok, let's talk.  Who thought it worked?  Who didn't?  Why?
4:00  How could you prove your side?  What would you do?  (If they don't know, gently guide them toward making their own model)  What supplies would you need?  What information would you need?
6:00  Here's what I can give you:  Graph paper, rulers, scissors and markers.  You have 5 minutes to create your own ACCURATE candy bar.  (For your information, the side length ratio is 3.5:6, you can decide if this is helpful for your students, I think it would be, but could make construction challenging!)
11:00  Now that you have this candy bar, you want to "break" it accurately.  How could you "cut" this candy bar accurately?  (The bar, if students watch carefully, is cut on a diagonal from 1.5 "squares" up on the left through 1.5 "squares" down on the right.  But I would encourage kids to measure angles as well.) 
13:00  Next, we need to break the top piece into three smaller pieces.  How should we do that?  (This is a much easier "cut" since they are clear vertical and horizontal lines.)
15:00  Finally, we need to take out the extra square.  (I would have the kids label the pieces either by number, letter, or size.  I'll call them "single", "double", Small, medium and Large for my explanations.)
16:00  Now slide your medium piece up and your small piece over and down.  Fill the gap with your double piece.  Discuss what you see with your partner!
18:00  What did you see?  How do you explain the extra piece?  (Hopefully they see that the "squares" are not the right size or dimensions and to get them to "line up, the students need to shift the small and medium pieces "up" a bit leaving a long thin "gap" between the top and bottom.  Almost like the photo to the right.)
19:00 Does your extra piece "fill the gap"?  Is this real "infinite" chocolate? Why or why not?

How to use this as a full lesson?
I would definitely use the mini lesson above, allowing for more freedom if students are enjoying the exploration and discussion.  Depending on the grade level I would also ask appropriate questions and use appropriate vocabulary.

For example, if you repeated this experiment without the "squares" of chocolate and one large bar, could you prove congruence?  Why or why not?  If you can prove congruence, explain the criteria for congruence and back up your answer mathematically.  If not, what mathematical proof (not just modeling) could you use to justify why these are not congruent?

Why are the "small" and "Medium" pieces NOT similar?  Use definitions, properties, and measurements to back up your claim.

What is the ACTUAL area of the original?  What is the actual area of the final candy bar (minus the extra square)?  Does this prove that they are or or not congruent?

After these explorations, I would show the video linked here.  This is a similar optical illusion, trick, or manipulation.  Encourage your students to watch, either as a class, or on their individual devices.
I apologize in advance for the ad that precedes the video, but you can skip it after 5 seconds. 


I would ask students to watch out and consider these questions as they watch:
What are the original dimensions?
What is the original area?
What do you notice about the space in the "box" as he shakes it?
What do you notice about the cuts of the pieces?
What do you notice as he lays out the tiles the first time?
As he moves them, what do you see?
As he places them back the box what do you see?
As he "repeats" or "reverses" the trick, what do you see?

Can you explain his "trick" mathematically?

Use your number sense.  (I think you can see more "wiggle"room once the 3 squares are removed, and 3/63 is such a small percentage of change, it's not too obvious.  Add to that the fact that he has a very hard time at the end of the video making them all fit again!)

Ask the students to justify, model, draw, explain, etc.  They should use correct mathematical vocabulary, appropriate skill and relationships to their learning.  For example, can they discuss area and congruence?  Can they name shapes and angles?  Can they formally prove or disprove congruence?

How to use this as an assessment?
To use this as an assessment, I'd do the mini lesson at the beginning of a unit, refer to it throughout the unit as we are using vocabulary and talking about proof, and then I would show the video at the end.  I would assess the students on their explanation of the "trick" and how well they used what they had learned.

You would definitely want to create your own rubric before the assignment.  You would also want ample supplies for students, as well as multiple devices, as students will want to watch the video over and over as they work.  (Isn't it awesome that the video is nearly silent??)

Please feel free to use any of these ideas and modify them to meet your needs.  However, please acknowledge the original source of the items and my own lesson outlines.  ©NatalieRSprigg 2013 

Wednesday, June 5, 2013

Giant's Causeway

Personal Reflection:

One of my most favorite places in the whole world (that I've never actually been to) is The Giant's Causeway in northern Ireland.

The summer after college I was a nanny for my cousins in a small town outside of Dublin called Dunboyne.  I was too young to get my Irish driver's license and ended up taking the kids to the city on the bus.  We did get to take weekend trips with the family to southern Ireland, but while I was there there was just too much unrest to visit up North.

Thus, this is the most amazing place in the world that I've always wanted to go to, but never have.  :)

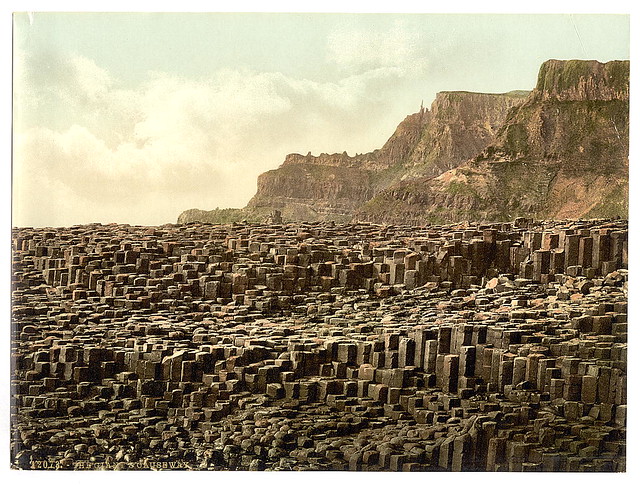
The Giant's Causeway is a natural formation of rocks on the northern coast between Ireland and Scotland.  As you can see from the photos, these spires of rock form beautiful polygons, often hexagons, but reports are anything from quadrilaterals to nonagons. 

This, to me, is full of opportunities for great instruction.  I can see anything from estimation and basic polygon identification (3rd Grade) to tessellations and transformations. 

For this reason, I feel the EQUATE model is a perfect opportunity to explore these photos and this location.  Rather than focusing on a single grade, I encourage you to use the EQUATE thinking routine to apply appropriate standards at your grade level.

Grade Level: 3-HS

Course: Math, Pre-Alg, Algebra, Geometry

Standards:  3.MD.8, 3.G.1, 3.G.2, 4.MD.5, 4.G.1, 4.G.2, 4.G.3, 5.MD.5, 5.G.3, 5.G.4, 6.G.1, 6.G.2, 6.G.3, 6.G.4, 7.EE.3, 7.EE.4, 7.G.1, 7.G.6, 8.G.1, 8.G.2, 8.G.3, 8.G.4, G-CO.1, G-CO.2, G-CO.5, G-CO.6, G-CO.7, G-GPE.7, G-GMD.2, G-GMD.3, G-MD.1, G-MD.3
SMP: MP.1, MP.2, MP.3, MP.4, MP.5, MP.6, MP.7, MP.8
Skills: Estimation, Number sense, reasoning, modeling, geometry, geometric shapes, properties of shapes, area, perimeter, volume.


How to use this as a mad minute:
You have 60 seconds. Name all of the shapes you can see.

How to use this as a warm up:
You could ask the students to consider one of the following:
1.  Name the shapes you see.
2.  Does this fit the definition of a tessellation? Why or why not?
3.  Are these "regular" polygons?  Why or why not?

How to use this as a mini-lesson:
If I only had 20 minutes, I would use technology to explore this VERY COOL region.  This website has an awesome interactive map, some history, and the legend of the Giant's Causeway.

http://www.voicesfromthedawn.com/the-giants-causeway/

How to use this as a full lesson?
As I mentioned before, I feel that this is an ideal EQUATE lesson.  Although there is a ton of math that is obvious to an instructor, this captivates my interest because of the combination of legend, scientific history, and visual appeal.  I feel your students will also be drawn to these elements.  If you are comfortable, let the students dictate the direction of the lesson and exploration (within reason).

I would show these photos, let the students explore, discuss, etc.
Then I would list all of their questions, encouraging them to "wonder mathematically" about them.
Focused on grade-level appropriate standards, I would ask students to narrow down the questions to make sure they are relevant to things you have already explored or discussed in your class.
I would let the students ask YOU questions and you can provide the answers you feel are appropriate.  (How are they formed?  How big is the region?  How many are there?  You can provide as much or as little information as you wish.)
I would settle on a question (or two or three) for your students to apply their knowledge and continue to try to solve.  Encourage them to TRY something!  Draw on the photo, measure it, get online and do research, look up formulas that might be useful, gather information, start playing with the numbers, rules, formulas, photos, etc.
Finally, ask the students to Explain what they did, what they found, and how they approached the problem.

 How to use this as an assessment?
It is up to you if you think your students can use this as an assessment appropriately.

It could be something as simple as providing the first photo and asking students to outline as many different shapes as they can see and explain why they are different and what they are (Elementary School).

It could be more advanced, offering the size of the region, the size of an individual "step" and asking the students to estimate how many are in the entire region.  (Upper Elementary to Middle School.)

You could ask the students to find two similar "steps" and justify why they are similar (Middle/High).

You could ask the students to find the volume of two or three different "steps" and justify their solution methods.  (Middle/High).

You could ask the students to PROVE that two items are congruent or similar based on transformations such as rotations, reflections, etc.

Works Cited:
Photo 1
Description: Giant's Causeway and Causeway Coast
Copyright: © Philippe Croo
Author: Philippe Croo
Image Source: Philippe Croo  (Link)

Photo 2
http://farm3.staticflickr.com/2755/4427445338_7869405855_z.jpg?zz=1

Photo 3
https://garystravel.wordpress.com/page/107/


Please feel free to use any of these ideas and modify them to meet your needs.  However, please acknowledge the original source of the items and my own lesson outlines.  ©NatalieRSprigg 2013 

Saturday, June 1, 2013

Snow White Transformations Matrix

Personal Reflection:

Wow.  When I saw this, I was so excited!  Although it's been awhile since I worked with a matrix, or matrices, I thought I quickly understood what was happening.  As I explored further, I realized, I needed a refresher.  Plus, what an amazing way to illustrate the changes.  This "Snow White" has enough detail that we can clearly see the x and y transformations.  I love it and I've barely even begun to explore it.

I'm disappointed to report that the Algebra II courses in my school do not teach matrices.  Why is this a surprise to me?  I never saw a matrix until I set foot in College Algebra my first day of college.  Oops, that was a major mistake!  I know now that even the briefest exposure would have been invaluable.  That being said, as the standards make a transition to understanding properties of shapes and proofs of theorems through transformations, this type of analysis and thinking cannot be ignored.  I hope that by creating and applying this to mini lessons, lessons, and assessments, my colleagues will see the value and return to teaching matrices. 

This image was obtained from this site.

Grade Level: High School
Course: Algebra II (Most likely)
Standards:  N-VM.7, N-VM.10, N-VM.12, A-REI.9,
SMP: MP1, MP2, MP3, MP4, MP6, MP7, MP8
Skills: Properties of Matrices, Matrix Identities, Transformations of matrices, linear transformations 

How to use this as a mad minute:
You have 60 seconds.  Choose one transformation and explain why the image is accurate.  

How to use this as a warm up:
You could ask the students to consider one of the following:
1.  What does the identity matrix represent?
2.  What would the identity Snow White look like?  How do you know?
3.  Explain the Wicked Queen matrix.
4.   Personally, I think this would be more accurate, and more appropriate, if it were the Alice in Wonderland Matrix.  Why?
5.  Can you think of another transformation?  Draw the matrix and the resulting "Snow White" image.

How to use this as a mini-lesson:
20 minutes, assuming kids DO know about matrices and the basics of transformations.

0:00--This Snow White image caught my eye.  Take 2 minutes to read, study, explore, and think about it.  Make notes, list questions, draw pictures, etc.
2:00--Ok, anyone want to share immediate thoughts and reactions? (Hopefully the kids will share some of these thoughts, but if not, try to lead them in these general directions.  Remember that if they go in a direction that you don't expect, but is valuable, take that path and abandon mine!)
4:00--Let's talk about the identity.  Why do you think the artist never drew the identity?  Do you think you could?  Take a minute to do your best.  You may want to draw another one next to it to show the difference.  For example, draw Scaley and then draw the identity.
6:00--Can we talk for a minute about why the artist used the name Scaley?  Any guesses why?  (If kids don't see the connection between "y" and the "y" value and the "y" axis, don't push it.  You'll come back to it.  If they do, ask them to check and see if their theory works for all of the examples as you discuss and review.)
6:00--What does the identity represent in any matrix?  How does that relate to any geometric figure?
7:00--What's the difference between Scaley and Scalex?  Do you think someone unfamiliar with those could figure it out by looking at the two images?
9:00--What about the difference between Reflecty and Reflectx?
10:00--So, let's revisit the question about Scaley vs. Scalex and Reflecty vs. Reflectx.  Why those names?  Are they clear and obvious, now?  Did your hypothesis work out?
11:00--Let's look at the rotation example.  If the matrix is named "A", the element A1,2 is -1.  Why did that cause the rotation shown?
12:00--What would happen if you made A2,1 = -1?  What kind of rotation would you get?  Do you know?
14:00--What would happen if both elements were -1?  Can you predict?
15:00--What do you think the Wicked Queen matrix does?  Explain.
17:00--Take the next 3 minutes to draw a simple, yet distinct figure.  Notice that Snow White has a bow on the left side of her head, and a distinct top and bottom half.  Try to create at least 3 transformations by drawing the matrix first and then drawing the resulting figure.

How to use this as a full lesson?
Honestly, when I saw this, as much as I loved it, I really wondered why it wasn't Alice, from Alice in Wonderland, instead.  After all, who better to use for stretching and shrinking?

I would do the mini lesson above, but then show the two movie clips below.  One is 6 minutes long and one is 1 minute long.  (The first is from my personal favorite live action version from 1985!  Please let me know if these video clips expire or the links no longer work!)


I would challenge the students to create, while watching, a quick timeline of the transformations.  For example:
Normal size--drink potion--become small
Small--eat cake--become larger than normal
etc.

Then, have them get in groups and try to create matrices that would create the transformations.  They need to be able to back them up.  Give them 10 to 15 minutes.

After this, ask them to share their results.  (Poster?  Write it on the board?  Hold up their dry erase board?)  They have to convince you that their matrix is better than another group's.  (It might be more accurate, it might better account for her change in size in both directions, etc.)

Let there be a debate.  Let kids really argue for why theirs is the best.  You can decide if they should get time to revise their answers and try again, or if they have to stick with their first answers.  (Revisions would encourage kids to learn, assess, and fix!)

From there, I would choose a simple cartoon figure and ask students to perform the given transformations.  (Sample worksheet here.)  I selected Kirby because he doesn't require much artistic strength to create simple transformations.  Also note that the worksheet I made doesn't ask students to draw.  If I had better software to create matrices, I might have included problems like that, but I didn't.  Some of your more creative students may better show their understanding by drawing various Kirby images to match given matrix transformations.

How to use this as an assessment?
You could use the worksheet above as a quiz (though something requiring artistic ability is not very fair!)

You could also use the video activity as an assessment tool instead of a team project.  You would need to create a rubric and more specific directions!


Please feel free to use any of these ideas and modify them to meet your needs.  However, please acknowledge the original source of the items and my own lesson outlines.  ©NatalieRSprigg 2013

Saturday, May 25, 2013

Penny Floor

Personal Reflection:

Finding photos like this on popular "student" sites like 9gag.com always makes me happy!  I know, right away, that this will get them to "wonder mathematically" and dive into exploring skills and concepts that they might not have ever wanted to consider in the past.  My "wondering" and wandering led me to questions like:  How much would it cost to tile that area?  Is using pennies the cheapest?  How does that compare to normal tile?  I hope that your students will wonder mathematically in their own ways!

Grade Level: 4-9

Course: Math, Pre-Algebra

Standards:  5.NBT.5, 5.NBT.7, 5.MD.1, 6.PR.3d, 6.NS.1, 6.NS.3, 6.EE.1, 6.EE.2, 6.EE.7, 6.G.1
SMP: MP1, MP2, MP3, MP4, MP5, MP6
Skills: Area, Unit conversions, exponential notation, estimation


How to use this as a mad minute:
You have 60 seconds.  How much do you think it would cost to cover the floor of our classroom in pennies?  Estimate accurately and be prepared to justify your estimate.


How to use this as a warm up:
You could ask the students to consider one of the following:
1. How much do you think it would cost to tile our floor in pennies?  Estimate accurately, show your work and steps and be prepared to explain.
2.  Do you think covering the floor with pennies would cost MORE or less than covering it with nickles?  dimes? quarters? dollar bills?  Why?
3. Do you think covering the floor with pennies would cost more or less than using a traditional floor covering such as tile or carpet?  Why?
4. Is there a currency in the world that would be better to use than pennies?  If you can't think of one, can you think of what properties it would need to have to be a better choice?
 

How to use this as a mini-lesson:
If I had 20 minutes to spend on this lesson, and the goal was for kids to estimate, use critical thinking skills, use their knowledge of area, and compute, this is what I'd do!

Show them the photos!  Let them talk with their friends about them for less than 60 seconds.
Give them a challenge.  Tell them that you will offer (____reward_____) for the student who is able to BEST estimate the cost of covering ONE DESK (or table) in your room in pennies.
"Best" estimate, as determined by me, would not only be accurate, but would be clearly justified and explained.  It would specifically address concepts such as measurement, how to compute area, etc.  I would NOT equally reward a group that "counted" how many pennies fit along each side and multiplied and a group that used measurements, staggering (to fit more in), repeated trials and samples, etc.  Although both may be right, one shows much more depth of analysis and thinking.  The first would be perfect for an answer in 5 minutes or less, and the second would be appropriate for a 20 minute exploration.
I'd offer them a selection of supplies:
  1. Baggies of 10 or fewer pennies
  2. Rulers or meter sticks
  3. Tape
  4. Paper
It would be up to the students what supplies they might use.


How to use this as a full lesson?

Use the EQUATE thinking routine.  Give them the photos with NO guidance.  Let them Explore, Wonder, and Question.

Record their questions and clarify!  Develop depth to the questions by extending them, drawing out detail and asking how they might go further.

For example, a student might ask, "How much would that cost?"  This is a great "wonder" but not enough to explore mathematically.  What are they going to investigate?  How can they extend this question?  As you draw out these ideas, make sure to ask them to list what information they need to answer their questions.  Feel free to share answers or to encourage them to FIND THEIR OWN answers.  This is a great time to use technology to your advantage.  Students can research on phones and iPods, or you can nominate a class researcher who will research the answers to these questions while you continue to work with the rest of the class.  Narrow down your questions to your top two or three questions.  Tell them they can choose from "These" deep understanding questions to answer in their next steps.  It could be something from the suggested warm ups with more depth, it could be calculating the cost of covering the floor of your room, their bedrooms, the hallway, etc.  For students who are advanced, ask them to compare the prices of using pennies to nickels and dimes with only a ruler and one of each coin. 

Establish expectations for products, time frames, behaviors, and jobs.

Set them free!  Help them question and explore and apply their mathematical knowledge to solve their problems and answer their questions.  

How to use this as an assessment?
You know your students best, and you know if you will have prepared them for this.  I know many teachers ask challenge questions such as, "How many boxes of Kleenex will it take to fill this classroom?" as assessment questions.  However, many other background experiences are necessary before students can attack these kinds of problems independently on an assessment.

If you feel you've provided similar learning experiences that would help a student successfully approach such a problem, go for it!
  • Ask a specific and clear question.
  • Be sure you know what kinds of answers you will accept.
  • Determine how much written and verbal guidance you will provide during the assessment.
  • Make sure you provide clear rubrics or standards for achievement.  Students need to know what will earn a passing, or excelling, grade!
  • Make notes of what works and what doesn't so you can improve it for next time.

Every school grades differently, sometimes based on standards, some using IB or pre-IB rubrics, some on critical thinking and creativity, some on a strictly points-based system.  While I cannot help every one of you, in the future I will update this with my own question, instructions, and rubric!


Please feel free to use any of these ideas and modify them to meet your needs.  However, please acknowledge the original source of the items and my own lesson outlines.  ©NatalieRSprigg 2013

Tuesday, May 21, 2013

Swimming Pools of Saliva

Personal Reflection:

Let's start off with being honest.  I do my share of internet surfing.  Two sites I visit regularly for their awesome "kid" content are uberhumor.com and 9gag.com.  You'll see their watermarks at the bottom of most of my photos.

This one stood out to me right away because I thought, "NO WAY!"   (And I bet your students will think that too!)  So, I thought, "Let's find out."
  

Grade Level: 3-8

Course: Math, Pre-Algebra

Standards:  6.EE.2, 6.EE.3, 6.EE.9, 6.G.2, 7.RP.1, 7.RP.2, 7.G.1, 7.G.6

SMP: MP1, MP2, MP3, MP4, MP5, MP7
Skills: Estimation, Volume, Unit conversion, Scientific Notation


How to use this as a mad minute:
Get out those smart phones, those electronic devices, iPods, laptops, iPads, etc.  Is this true?  Can you find an answer in 60 seconds or less?  GO!


How to use this as a warm up:
You could ask the students to consider one of the following:
1. List the information would you need to gather to determine this is true.
2.  Estimate how much saliva you produce in 1 hour.  1 day.  1 week.  1 year.
3.  How big is a swimming pool?  How much water do you think it holds?
4.  Calculate the volume of a swimming pool that is 50m x 25m x 2m.  (Olympic average.)
5.  How much saliva do you think is in a single cubic meter of water?
6.  If the volume of an Olympic Pool is 2,500,000 L, how much saliva does one person produce each day?

How to use this as a mini-lesson?
You have to decide how much freedom to give your students and how structured you want this to be.  It could be a great inspiration for how to find the volume of a rectangular prism (true swimming pools that are more like trapezoidal prisms), or how to convert between metric and English measurements, or how to convert between large and small numbers, or even how to use scientific notation appropriately.


Mini Lesson 1:  Volume
Let's find the volume of different pools!  (Olympic, neighborhood, backyard pools)
Olympic:  50m x 25m x 2m  (Note: Olympic pools are not rectangular prisms, but this is an average.)
Neighborhood:  25m x 10m x 1.5m  (Kids could find out their own measurements!)
Backyard:  Radius=2m, Depth= 1.5m (Cylinder volume!)

Mini Lesson 2:  Unit Conversion
Saliva is measured in ounces.  How much is 2,500,000 Liters  in ounces?  How do you convert?  What proportions do you use?

Mini Lesson 3:  Scientific Notation
An Olympic Swimming pool has a volume of about 2,500,000 Liters.  Write this in scientific notation.  If the average person creates 1 liter of saliva every day for 79 years, how much saliva will they create in a lifetime?  Write your answer in scientific notation.  Which number is larger?

Mini Lesson 4:  Is this reasonable?
If you are trying to do this as a mini lesson, kids will need as MUCH information as possible.  You will need to tell them how much an average pool holds.  (Olympic=2.5 million liters)  You'll need to tell them how much saliva a person produces each day.  (Approximately 1 liter)  How long does the average person live?  (In the US it is approximately 79 years)  Can you use this information to determine if the average person would fill a swimming pool with saliva?


How to use this as a full lesson?
Expand any of the mini lessons above to include practice problems, a homework worksheet, or a continued exploration.  For example:  How long would it take to fill a bathtub with saliva?  How much saliva does the city of Denver create each day?  Each year?  Is the amount of saliva created each year by the population of China MORE or less than the amount of water in The Great Lakes?

How to use this as an assessment?
You know your students best!  If I were doing this with a GOOD group of middle school students who had mastered volume, this is the assessment I'd give them.

Look at this meme!  Is it true?  Use your technology to research both saliva production and the size of swimming pools.  Then use your knowledge of volume to answer whether or not this is reasonable.   Justify your answers with clear mathematical knowledge and computation.  Use the rubric to get full credit!

My rubric would require showing formulas for volume and how it was computed, how they got their numbers for the dimensions of the pool and the amount of saliva and the life span, including documenting sources.  I'd want them to explain answers in complete sentences with correct mathematical vocabulary.

If your kids aren't ready for this freedom, structure it for them!  (But, please, give them a chance and build the opportunities.  They'll get there, I promise!)


Please feel free to use any of these ideas and modify them to meet your needs.  However, please acknowledge the original source of the items and my own lesson outlines.  ©NatalieRSprigg 2013