Personal Reflection:
I'm going to be honest right up front. I'm not a runner. So when I workout on a treadmill, it's a pretty slow jog. The beauty of this post is that if you choose to use it with your students, they can laugh and criticize the person on the treadmill and you can promise left and right it isn't you, and you can agree, the person here is one step above a sloth! :)
That being said, I can't be the only "numbers nerd" out there that is constantly doing mental math while working out. Maybe you count your reps when lifting weights and calculate the total pounds you've lifted? Maybe you set a swimming goal and are finding the fractional portion of your workout completed with each length or lap? Maybe you figure out how many hours you'll have to stay on the treadmill to burn that milkshake you enjoyed last night? I know I'm constantly looking at the numbers and doing a variety of calculations. I couldn't help but take a few photos today thinking that the wealth of information included on the screen is invaluable.
Skills: Algebra, Functions, Lines of best fit, slope, rate of change, real life application, computation, extrapolating data
How to use this as a mad minute: You have 60
seconds. List all of the questions you could answer given the four photos provided. How to use this as a warm up:
You could ask the students to consider one of the following:
1. Write down three reactions you have looking at these photos.
2. What information is provided in these photos?
3. Is this person moving at a constant rate? (Consider vertical movement as well as speed.)
4. Is this person burning calories at a constant rate?
5. Can you write an equation given the information above? (Try it!) How to use this as a mini-lesson: To use this as a mini-lesson, expand on the warm up questions above. You can ask students to make data tables, graph the data provided, and to compare rates of change and determine if a line of best fit is appropriate. Students can show the data in multiple ways and can then evaluate the graph, equations and tables to identify real-life meanings (What does the slope mean in the graph? What does the intercept represent?) A copy of all four photos on a single page is available here.
Note: I didn't provide my 20 minute script because I feel this is best used as an EQUATE lesson, below.
How to use this as a full lesson?
I feel this situation is IDEAL for the EQUATE lesson routine. As you may already know, this relies heavily on letting students explore what is most meaningful to them and then asking questions to guide their exploration and results. I can only outline what "might" happen, but students have ways of amazing us!
EXPLORE--Provide a photo copy of all four photos on a single page. Give them a few minutes to look at the photos and discuss them with their teammates. You may structure this conversation and provide guidelines as your classroom expectations dictate.
QUESTION--Ask the students to brainstorm the types of questions they could explore given these photos. What do they "wonder" about mathematically? Is there enough information to answer those questions? Remember to push your students to think mathematically and to ask questions appropriate for their grade level. Asking if it is linear is a great start, but asking if they can use information to tell MORE than that is key. Challenge them to ask and answer challenging questions. Questions I might expect or encourage:
Is the rate of linear (and/or) vertical movement constant? What about the rate of calories burned?
How fast is this person moving?
Based on the information I can see, were they always moving at this rate?
How long will it take to "climb" a mile?
How long will it take to "run" a marathon? What about burning off my favorite meal?
Note: Some questions are much more basic than others. The last few questions require analysis offered in the first two or three questions, but students could easily get "stuck" with having too much information or too many steps to explore.
Additionally, this is where students get to ask you for more information. If you can provide it, great! If not, push them to answer their question given the information provided or to do the research needed to answer the question. For example, I would NOT tell them whether or not the person was moving at a constant rate. I would, however, allow them to look up the number of feet in a mile or the length of a marathon. (I wouldn't tell them, but I'd help them access appropriate resources!)
APPLY--Remember to encourage your students to apply their learning! If students know how to write equations from a table of data, they should do so! If students know how to make accurate graphs, they should do so! This is a great time to reflect on the units you have worked on and what skills students have obtained. This will encourage students to apply those skills to their problem solving process.
TRY SOMETHING--Encourage the kids to get working! They may feel "stuck" or that they dont' know what to do. Try anyway! That's the goal. Get going, try something and see what happens. Of course, kids need guidance, but it is their job to take their exploration, their questions, their previous knowledge and apply it to work on finding solutions.
EXPLAIN--Students need to wrap up their exploration by explaining not only what they did, but why they did it, how their previous knowledge related to the problem, and what inferences they drew. They need to be able to justify their answers and how they know that their solution is both reasonable and accurate.
How to use this as an assessment?
If your students have experience with looking a real life data to explore questions like the ones above, let them go! Give them a challenge question and the data and make sure they don't just find a numeric answer but also that they explain their process and thinking!
I can't make this post fit my normal outline. It's just too basic to include in lessons, but too cool not to post or use in some way!
If you are a number nerd, like me, you love "special" numbers. You look for them on your clocks, in page numbers, on receipts and on your odometer! I love palindromic numbers, repetition in numbers, or special sequences, like the one on the right. I have a friend who also loves these special numbers and we often text each other when we hit cool numbers such as 12345, or 12121 or 12321, or 33333. When I saw this photo, I immediately wondered, "How much planning would that take?"
So, the question is pretty simple:
When did this person reset the "Trip A" counter to 0 to make this number appear?
If you want to push students a bit further, you could ask how many tanks of gas, days or weeks or months it would take to drive that far, how old is the car...but I love this one because it's simple. No standards, no lessons, just a quick, fun and easy exploration!
This is another photo from uberhumor.com. I find that this site, though not always student-appropriate, does have a mix of "items" that often lend themselves to discussion and exploration.
This is a pretty simple fact. It is easy to research the accuracy of this fact and determine that if the orbit of Uranus around the sun is 84 years, then "summer" or 1/4 of that time, would be 21 years. But to me, there's so much more to ask and so much more to explore.
This is also an ideal way to encourage students to use background knowledge to build a "case" for the accuracy of this fact and then confirm their answers electronically.
Note: As a special addition below, I included some ideas for interdisciplinary connections!
Grade Level: Middle School Course: Pre-Algebra Standards: Science: 5-8 Standard D, 9-12 Standard B (Though math is involved, I don't think this relates to specific standards.) SMP: SMP.1, SMP.2, SMP.3, SMP.6, SMP.8
How to use this as a mad minute:
You have 60
seconds. Outline your immediate reaction to this and back it up with either scientific or mathematical knowledge. How to use this as a warm up:
You could ask the students to consider one of the following:
1. If "summer" on Uranus lasts 21 years, what do you know about it's period of rotation about the sun?
2. Based on what you know about Uranus, what do you think "summer" looks and feels like?
3. The Earth is tilted on its axis by 23º. Uranus is tilted by 82º. What does that tell you about seasons on the planet?
4. The length of a day on Uranus is -0.718 Earth days. What does the number tell you? What does the negative mean? How to use this as a mini-lesson: Given 20 minutes, I would focus on discovery, exploration, and discussion. For this mini lesson students will need access to the internet.
0:00--Let's look at this image! (Show the graphic.) Take a minute to think about it and discuss your immediate reaction with a friend.
1:00--What did you see or say to your partners?
2:00--Let's brainstorm. What do you already know about seasons, Earth and Uranus? Talk with a partner, write down everything you can think of, you have two minutes!
4:00--Partner up with another group and share your lists. Add anything you don't have on your own. Put a ? mark next to anything you are unsure about or disagree with.
5:00--Repeat combining two more groups.
6:00--Let's share out what you know!
8:00--Let's share items you were unsure of or to which you put a ? mark. (Remember, you don't want them to ask, "Is this true?" just yet. This is a valid question, but we are trying to build and confirm background knowledge. Students WILL check out the validity of this number, but not quite yet. Explain to them that they can answer this question shortly, but we are focusing more on things like, "Seasons are caused by the tilt of a planet on its axis." or "Uranus is tilted much more on its axis." These are items that will help students answer the question on their own, eventually.)
9:00--You are going to have 3 minutes. I want you to research anything you listed EXCEPT the length of summer on Uranus! Make sure you find valid sites and make sure you document your sources!
12:00--Everyone had different questions. Did everyone find their answers? Were there any questions you were unable to answer? Can anyone help them or tell them the answer?
14:00--Let's see if you can use your knowledge to answer the following questions. I'm going to ask 2 questions and then give you and your team 3 minutes to answer them. You should NOT use the Internet to answer. 1. If summer is 21 years on Uranus, how long is a year? 2. Does the length of summer (or a year) relate to how big Uranus is or how far away it is from the Sun?
17:00--Confirm your answers using any resources you prefer!
19:00--So this simple graphic is TRUE! Awesome! What other questions would you like to explore now that you've seen this?
How to use this as a full lesson?
I really feel this is ideal for an EQUATE Lesson. (Click link for explanation.)
I can see the students wanting to know if this is true, but that is far too simple and can be answered easily by Google. It will require some fantastic questioning strategies from the teacher to guide students to more challenging or deep questions. Off the top of my head, I would want to explore the following questions:
Which planet has the longest and shortest "summers"?
Which planet has the longest and shortest days?
Does the size of the planet relate to the length of the "summer" or "day"?
Do other planets have seasons like summer? Why or why not?
What does "summer" look like on other planets? (For example, Earth is tilted on its axis as it rotates, creating seasons, but other planets are not tilted or are tilted nearly 90 degrees, this causes great variation. Also, gas planets don't heave "seasons" in the same way as others, and in some planets, though the temperatures vary, there's not what we would consider a season!)
Please note: Some of my questions seem basic, but, as any good teacher knows, the depth is in the WHY? So don't forget to ask!
How to use this as an assessment?
I don't feel this is appropriate for an assessment. (You may feel otherwise and of course, feel free to use it!)
Interdisciplinary Connections Ray Bradbury's short story "All Summer In A Day" is a great connection. However, it can be a bit disturbing and you should definitely preview it before using it with students.
There is also a short (30 min) movie version of "All Summer In A Day"
I would definitely work with your team to, perhaps, have students read the story, watch the movie, research seasons on planets and, it's up to you, then assess their understanding. My first thought is to separate students and hold a debate about how accurate the story/movie are, and whether or not this is a fair representation. Students would need to back up their arguments with scientific evidence about the seasons on various planets as well as other items of "accuracy" such as life on another planet.
Just based on the last two posts, you'd probably think I love chocolate. I don't! I just find things that spark my interest and I save them.
This image caught my eye because, off the bat, there seems to be a pretty strong correlation between chocolate consumption and Nobel Laureates. I thought it would be fun to investigate!
Skills: Algebra, Line of Best Fit, Correlation, Causation, Statistics, Problem Solving, Reasoning, Critical Thinking
How to use this as a mad minute:
You have 60
seconds. Explain what this graphic implies in 1 clear and specific sentence. How to use this as a warm up:
You could ask the students to consider one of the following:
1. Does this image have all of the essential elements of a clear graph?
2. Do you think the use of flags and country names enhances or detracts from the image? Why?
3. Do you see a possible correlation? Why or why not? If so, what kind?
4. What does the "r" value tell you about this graph?
5. Which country consumes the most chocolate? The least? Which country has the most Nobel Laureates? The least? How to use this as a mini-lesson: I'm disappointed that the data isn't available. I would love to have kids use their graphing calculators and a data table to generate equations of best fit. I guess we just have to trust the info that is provided. I did find the original article. Linked here.
0:00--Take a look at this and then take a minute to discuss it with a partner.
2:00--What did you notice? What stood out to you?
3:00--Do you think it is fair to make the argument "The more chocolate you eat, the more likely you are to win a Nobel Prize?" (Feel free to adjust the statement to better match what your students say!)
5:00--Do you see any data that might be considered an outlier? (If your students know the mathematical formula for outliers, feel free to apply it! I would just discuss "in general" rather than doing it in that much detail.)
6:00--Do you see any correlation? Where? (Hopefully they can tell you they see it visually in the data points, but also that they recognize the "r" value in the image.) What does that mean?
7:00--What questions do you have about this data, the study, or the relationship? (Have them partner up, list their questions and then gather them back together to share out. Write their questions down.)
10:00--If we draw a line of best fit, what would it tell us?
11:00--What would the slope tell us?
12:00--Work with a partner to write the line of best fit. (Give an enlarged copy of the image.)
17:00--What is the difference between correlation and causation?
18:00--Can you think of other things that might have a correlation with no causation? (Here's a site that has some great examples!)
20:00--Do you think this is an example of correlation without causation? Why or why not?
How to use this as a full lesson?
I would definitely start with the mini lesson. The ending question is a great point for the students to explore further.
Below I have 4 links to information about this "Nobel vs. Chocolate" image, research, etc. I would ask the students to break up, study the information and be prepared to come back and share the information with others. (I would do a jigsaw.)
After their jigsaw, I would ask students to form an opinion about the graphic. I'm thinking something in the range of:
I think the research and data are accurate and logical.
I think the reasearch is accurate but the causation link is missing.
I think the research and data are inaccurate.
(Of course any other opinions are totally fine!)
I would then ask students to back up their answers with examples from the texts they read, their own background knowledge, correct mathematical vocabulary, etc. I would ask them to do it in a 1 page poster.
How to use this as an assessment?
See the lesson above, it includes an assessment tool.
Another option would be to simply give students the graphic on a test, as an activity, etc, and ask them to reflect on the image. (I would provide a word bank or other guidance on the types of "reflection" you want them to do! My word bank might include: linear, correlation, causation, accuracy, misleading.)
This was one of the first images I've seen in a long time that inspired me to actually investigate and try to explain what was happening. I didn't just try to use logic, reason, estimation, etc. I actually got out graph paper, scissors, tape and MADE a paper chocolate bar. If it can inspire me to build and play, I'm sure it will do the same for students.
Skills: Geometry, Area, Constructions, Modeling, Problem Solving, Ratio, Proportion, Scale How to use this as a mad minute:
You have 60
seconds. Give me one reason you think this DOES or does NOT work. How to use this as a warm up:
You could ask the students to consider one of the following:
1. What is the area of the original chocolate bar in generic "units"?
2. What is the area of the new chocolate bar in generic "units"?
3. When the candy bar is broken up, there are 5 pieces. Describe each piece using a correct geometric name and explain what properties each piece has to categorize them.
4. Draw the 5 pieces on your paper (sketch!) and then label the angles. (Acute, obtuse, right, straight.)
5. What is the perimeter of the original candy bar? Is the final perimeter the same or different? How to use this as a mini-lesson:
Please note: I included screen shots of the candy bar when it isn't moving for YOU to use, but largely, it would take away some mystery for the kids, so I probably would NOT show the photos to them.
0:00 Look at this awesome gif! Have you seen this online? If so, what did you think? Watch and then turn and discuss with a partner.
1:00 If you haven't already discussed with a partner, focus on whether or not you think this works and why.
2:00 Ok, let's talk. Who thought it worked? Who didn't? Why?
4:00 How could you prove your side? What would you do? (If they don't know, gently guide them toward making their own model) What supplies would you need? What information would you need? 6:00 Here's what I can give you: Graph paper, rulers, scissors and markers. You have 5 minutes to create your own ACCURATE candy bar. (For your information, the side length ratio is 3.5:6, you can decide if this is helpful for your students, I think it would be, but could make construction challenging!)
11:00 Now that you have this candy bar, you want to "break" it accurately. How could you "cut" this candy bar accurately? (The bar, if students watch carefully, is cut on a diagonal from 1.5 "squares" up on the left through 1.5 "squares" down on the right. But I would encourage kids to measure angles as well.) 13:00 Next, we need to break the top piece into three smaller pieces. How should we do that? (This is a much easier "cut" since they are clear vertical and horizontal lines.)
15:00 Finally, we need to take out the extra square. (I would have the kids label the pieces either by number, letter, or size. I'll call them "single", "double", Small, medium and Large for my explanations.)
16:00 Now slide your medium piece up and your small piece over and down. Fill the gap with your double piece. Discuss what you see with your partner!
18:00 What did you see? How do you explain the extra piece? (Hopefully they see that the "squares" are not the right size or dimensions and to get them to "line up, the students need to shift the small and medium pieces "up" a bit leaving a long thin "gap" between the top and bottom. Almost like the photo to the right.)
19:00 Does your extra piece "fill the gap"? Is this real "infinite" chocolate? Why or why not?
How to use this as a full lesson?
I would definitely use the mini lesson above, allowing for more freedom if students are enjoying the exploration and discussion. Depending on the grade level I would also ask appropriate questions and use appropriate vocabulary.
For example, if you repeated this experiment without the "squares" of chocolate and one large bar, could you prove congruence? Why or why not? If you can prove congruence, explain the criteria for congruence and back up your answer mathematically. If not, what mathematical proof (not just modeling) could you use to justify why these are not congruent?
Why are the "small" and "Medium" pieces NOT similar? Use definitions, properties, and measurements to back up your claim.
What is the ACTUAL area of the original? What is the actual area of the final candy bar (minus the extra square)? Does this prove that they are or or not congruent?
After these explorations, I would show the video linked here. This is a similar optical illusion, trick, or manipulation. Encourage your students to watch, either as a class, or on their individual devices.
I apologize in advance for the ad that precedes the video, but you can skip it after 5 seconds.
I would ask students to watch out and consider these questions as they watch:
What are the original dimensions?
What is the original area?
What do you notice about the space in the "box" as he shakes it?
What do you notice about the cuts of the pieces?
What do you notice as he lays out the tiles the first time?
As he moves them, what do you see?
As he places them back the box what do you see?
As he "repeats" or "reverses" the trick, what do you see?
Can you explain his "trick" mathematically?
Use your number sense. (I think you can see more "wiggle"room once the 3 squares are removed, and 3/63 is such a small percentage of change, it's not too obvious. Add to that the fact that he has a very hard time at the end of the video making them all fit again!)
Ask the students to justify, model, draw, explain, etc. They should use correct mathematical vocabulary, appropriate skill and relationships to their learning. For example, can they discuss area and congruence? Can they name shapes and angles? Can they formally prove or disprove congruence?
How to use this as an assessment?
To use this as an assessment, I'd do the mini lesson at the beginning of a unit, refer to it throughout the unit as we are using vocabulary and talking about proof, and then I would show the video at the end. I would assess the students on their explanation of the "trick" and how well they used what they had learned.
You would definitely want to create your own rubric before the assignment. You would also want ample supplies for students, as well as multiple devices, as students will want to watch the video over and over as they work. (Isn't it awesome that the video is nearly silent??)
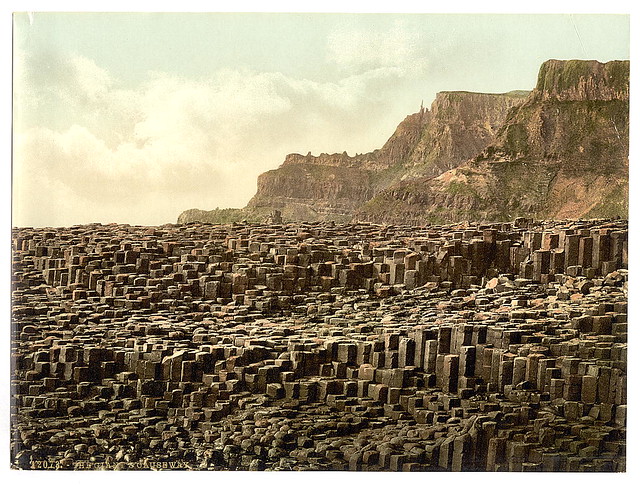
One of my most favorite places in the whole world (that I've never actually been to) is The Giant's Causeway in northern Ireland.
The summer after college I was a nanny for my cousins in a small town outside of Dublin called Dunboyne. I was too young to get my Irish driver's license and ended up taking the kids to the city on the bus. We did get to take weekend trips with the family to southern Ireland, but while I was there there was just too much unrest to visit up North.
Thus, this is the most amazing place in the world that I've always wanted to go to, but never have. :)
The Giant's Causeway is a natural formation of rocks on the northern coast between Ireland and Scotland. As you can see from the photos, these spires of rock form beautiful polygons, often hexagons, but reports are anything from quadrilaterals to nonagons.
This, to me, is full of opportunities for great instruction. I can see anything from estimation and basic polygon identification (3rd Grade) to tessellations and transformations.
For this reason, I feel the EQUATE model is a perfect opportunity to explore these photos and this location. Rather than focusing on a single grade, I encourage you to use the EQUATE thinking routine to apply appropriate standards at your grade level.
How to use this as a mad minute:
You have 60
seconds. Name all of the shapes you can see. How to use this as a warm up:
You could ask the students to consider one of the following:
1. Name the shapes you see.
2. Does this fit the definition of a tessellation? Why or why not?
3. Are these "regular" polygons? Why or why not? How to use this as a mini-lesson: If I only had 20 minutes, I would use technology to explore this VERY COOL region. This website has an awesome interactive map, some history, and the legend of the Giant's Causeway.
How to use this as a full lesson?
As I mentioned before, I feel that this is an ideal EQUATE lesson. Although there is a ton of math that is obvious to an instructor, this captivates my interest because of the combination of legend, scientific history, and visual appeal. I feel your students will also be drawn to these elements. If you are comfortable, let the students dictate the direction of the lesson and exploration (within reason).
I would show these photos, let the students explore, discuss, etc.
Then I would list all of their questions, encouraging them to "wonder mathematically" about them.
Focused on grade-level appropriate standards, I would ask students to narrow down the questions to make sure they are relevant to things you have already explored or discussed in your class.
I would let the students ask YOU questions and you can provide the answers you feel are appropriate. (How are they formed? How big is the region? How many are there? You can provide as much or as little information as you wish.)
I would settle on a question (or two or three) for your students to apply their knowledge and continue to try to solve. Encourage them to TRY something! Draw on the photo, measure it, get online and do research, look up formulas that might be useful, gather information, start playing with the numbers, rules, formulas, photos, etc.
Finally, ask the students to Explain what they did, what they found, and how they approached the problem.
How to use this as an assessment?
It is up to you if you think your students can use this as an assessment appropriately.
It could be something as simple as providing the first photo and asking students to outline as many different shapes as they can see and explain why they are different and what they are (Elementary School).
It could be more advanced, offering the size of the region, the size of an individual "step" and asking the students to estimate how many are in the entire region. (Upper Elementary to Middle School.)
You could ask the students to find two similar "steps" and justify why they are similar (Middle/High).
You could ask the students to find the volume of two or three different "steps" and justify their solution methods. (Middle/High).
You could ask the students to PROVE that two items are congruent or similar based on transformations such as rotations, reflections, etc.
Not all of my inspiration comes from lame humor sites. :) Just the other day I was watching a rerun of "Friends" (probably while working on a blog post) and saw this intro. I can't embed the video (but a link is included here), but did include screen shots. Basically, Chandler has a Gym Membership that he doesn't use and can't get out of.
Here's the thing: I think that in order to create TRUE mathematicians, kids need to "wonder mathematically" much more often. Sure, they might laugh at the joke, but do they ever "wonder" what those numbers actually mean? Do they have any number intuition? Can we GET kids to wonder mathematically? My EQUATE thinking model asks kids to do just that. Unfortunately, I'm not sure that this is cut out to be an EQUATE type of problem.
Grade Level: 4 & 5 (Though, a fun, quick warm up at nearly any grade!)
Course: 4th &5th Grade Math
Standards: 4.NBT.1, 4.NBT.5, 4.NBT.6, 5.NBT.6 SMP: MP1, MP3, MP4 Skills: Multiplication and Division, Unit Conversion
How to use this as a mad minute:
You have 60
seconds. Estimate how long it has been since Chandler went to the gym. Estimate how much money he has wasted. How to use this as a warm up:
You could ask the students to consider one of the following:
1. How long has it been since Chandler went to the gym? Write your answer in weeks and months. Should your answer be written in years? Why or why not?
2. How much money has Chandler wasted by not going to the gym?
3. List 3 things that Chandler could have purchased with that money.
4. Explain how you could have estimated the answers to problems 1 & 2 using mental math. How to use this as a mini-lesson:
Let's be honest. This isn't going to be a major lesson at any grade level. It's going to be a silly, fun, and quick activity to focus kids on thinking mathematically and to be aware of the math around them every day.
Usually I offer 20 minute mini-lessons. I feel that if you want to use it as a mini-lesson, expand on the questions outlined in the warm up. Give them time to reflect with partners, work with groups, explain their thinking and show their work. REALLY focus on number sense, estimation, and mental math. Consider giving a small prize (pencil? Sticker?) to the student who estimates the length of time and expense most accurately.
How to use this as a full lesson?
See above.
However, here are several other math "fails" in TV and movies that might spark discussion in classes for basic math.
I don't know the name of this movie/show, but it is Ma and Pa Kettle.
Abbott and Costello (Selling vacuum cleaners)
Abott and Costello (Donuts) Note: The math logic is the same as the vacuums!
Abbott and Costello (Two Tens for a Five)
Abbott and Costello (It's Payday!)
How to use this as an assessment?
I wouldn't! If you want to, choose one of the videos above and ask the students to explain the flaws in their thinking!
If you haven't seen my post from earlier tonight (Life is a Complex Plane), you might not know how much I LOVE the site thisisindexed.com. Jessica Hagy is an amazing author, creator, philosopher and critical thinker. I didn't create lessons for these. I just wanted to share them!
Personal Reflection:
I love when someone, more creative than myself, is able to combine really awesome math with really deep thinking. I keep thinking that if we want to create critical thinkers, the people who create these kinds of images are the epitome of critical thinkers. So...can we get kids to do the same?
How to use this as a mad minute:
You have 60
seconds. Explain your interpretation of this graph to a partner. How to use this as a warm up:
You could ask the students to consider one of the following:
1. If you had to give a title to each axis that would encompass the extremes, what would it be?
2. Explain the relationships in each quadrant.
3. Do sleepiness and joy have a direct or inverse relationship?
4. Do you agree with the 4th quadrant? Why or why not?
5. Do you believe that dreams and reality are opposites? Why or why not? Use mathematics to back up your argument. How to use this as a mini-lesson:
I'm going to assume (bad idea?) that you'll use this with kids who are familiar with the coordinate plane, the quadrants and how to read them. This is not an introduction, but an elevation! We've got 20 minutes? Here we go!
0:00--Take 1 minute to read this, analyze it, and think about whether or not you agree with it.
1:00--Now, without talking, take the next minute to jot down your ideas, thoughts, etc. You can draw, you can write, you can use notes, anything you want.
2:00--Now partner up and compare your thinking. You have 60 seconds.
3:00--Ok, let's share out some ideas, thoughts and reflections. What did you see? Agree on? Disagree on?
6:00--Ok, I'm interested in seeing if you can create your own "Complex Plane." Let's start with 60 seconds of brainstorming opposites.
7:00--Let's list those where everyone can see them.
9:00--Ok, here's the challenge. Take two pairs of opposites and put them on your axes. (Dry erase boards, math journals, notebooks, etc.) Now, try to imagine what each quadrant would represent. (I'm going to include my own example, because it's not as easy as you might think! First, the challenge is not to be swayed by the previous example. I kept thinking of joy and sadness, or night and day, which both felt too close to the original. I chose Hot & Cold and then Starving & Full. I was thinking of temperatures of food, but without a title, that might not be clear. Then I had to think, what food would be amazing hot and would make you full? Not too hard for a high schooler to choose. Pizza, Pasta, Cheeseburgers could all work. Next, what would make you full when it is cold. Ok. Done. But what food would you starve rather than eat? Hot uncooked fish? What food would you starve if you ate it cold? That was the hardest. Mine is not perfect, but it's my first effort. I recommend you try this yourself several times before you ask the kids to do it!)
10:00, 11:00, 12:00--Check in on kids' progress. Encourage them to keep going. Ask them to create more than one if they struggled.
13:00--Let's partner up and share your results. DO NOT EXPLAIN. Ask your partner to study yours and then tell you what they think it shows. Then flip. You'll have 3 minutes total.
16:00-There is a fantastic website that creates graphical images like this almost every day. thisisindexed.com. Examine these two images. Then try to create your own!
How to use this as a full lesson?
I probably wouldn't. I think this is an engaging activity that sparks creativity, but is NOT destined for an entire class period. However, if you wish, you can explore thisisindexed.com and select other images. From there you can ask students to explain what is happening and to try to create their own.
Another option is for students to explore the site on their own (warning: a few images do pertain to more mature subject matter) and ask them to select their 4 favorites, analyze them and be prepared to explain them. Browsing will take a lot of time!
How to use this as an assessment?
I don't feel this is appropriate for a summative assessment. Formative assessment will take place as you listen to student discussions and explanations.
Wow. When I saw this, I was so excited! Although it's been awhile since I worked with a matrix, or matrices, I thought I quickly understood what was happening. As I explored further, I realized, I needed a refresher. Plus, what an amazing way to illustrate the changes. This "Snow White" has enough detail that we can clearly see the x and y transformations. I love it and I've barely even begun to explore it.
I'm disappointed to report that the Algebra II courses in my
school do not teach matrices. Why is this a surprise to me? I never
saw a matrix until I set foot in College Algebra my first day of
college. Oops, that was a major mistake! I know now that even the
briefest exposure would have been invaluable. That being said, as the
standards make a transition to understanding properties of shapes and
proofs of theorems through transformations, this type of analysis and
thinking cannot be ignored. I hope that by creating and applying this
to mini lessons, lessons, and assessments, my colleagues will see the
value and return to teaching matrices.
Grade Level: High School Course: Algebra II (Most likely) Standards: N-VM.7, N-VM.10, N-VM.12, A-REI.9, SMP: MP1, MP2, MP3, MP4, MP6, MP7, MP8 Skills: Properties of Matrices, Matrix Identities, Transformations of matrices, linear transformations
How to use this as a mad minute:
You have 60
seconds. Choose one transformation and explain why the image is accurate. How to use this as a warm up:
You could ask the students to consider one of the following:
1. What does the identity matrix represent?
2. What would the identity Snow White look like? How do you know?
3. Explain the Wicked Queen matrix.
4. Personally, I think this would be more accurate, and more appropriate, if it were the Alice in Wonderland Matrix. Why?
5. Can you think of another transformation? Draw the matrix and the resulting "Snow White" image. How to use this as a mini-lesson:
20 minutes, assuming kids DO know about matrices and the basics of transformations.
0:00--This Snow White image caught my eye. Take 2 minutes to read, study, explore, and think about it. Make notes, list questions, draw pictures, etc.
2:00--Ok, anyone want to share immediate thoughts and reactions? (Hopefully the kids will share some of these thoughts, but if not, try to lead them in these general directions. Remember that if they go in a direction that you don't expect, but is valuable, take that path and abandon mine!)
4:00--Let's talk about the identity. Why do you think the artist never drew the identity? Do you think you could? Take a minute to do your best. You may want to draw another one next to it to show the difference. For example, draw Scaley and then draw the identity.
6:00--Can we talk for a minute about why the artist used the name Scaley? Any guesses why? (If kids don't see the connection between "y" and the "y" value and the "y" axis, don't push it. You'll come back to it. If they do, ask them to check and see if their theory works for all of the examples as you discuss and review.)
6:00--What does the identity represent in any matrix? How does that relate to any geometric figure?
7:00--What's the difference between Scaley and Scalex? Do you think someone unfamiliar with those could figure it out by looking at the two images?
9:00--What about the difference between Reflecty and Reflectx?
10:00--So, let's revisit the question about Scaley vs. Scalex and Reflecty vs. Reflectx. Why those names? Are they clear and obvious, now? Did your hypothesis work out?
11:00--Let's look at the rotation example. If the matrix is named "A", the element A1,2 is -1. Why did that cause the rotation shown?
12:00--What would happen if you made A2,1 = -1? What kind of rotation would you get? Do you know?
14:00--What would happen if both elements were -1? Can you predict?
15:00--What do you think the Wicked Queen matrix does? Explain.
17:00--Take the next 3 minutes to draw a simple, yet distinct figure. Notice that Snow White has a bow on the left side of her head, and a distinct top and bottom half. Try to create at least 3 transformations by drawing the matrix first and then drawing the resulting figure.
How to use this as a full lesson?
Honestly, when I saw this, as much as I loved it, I really wondered why it wasn't Alice, from Alice in Wonderland, instead. After all, who better to use for stretching and shrinking?
I would do the mini lesson above, but then show the two movie clips below. One is 6 minutes long and one is 1 minute long. (The first is from my personal favorite live action version from 1985! Please let me know if these video clips expire or the links no longer work!)
I would challenge the students to create, while watching, a quick timeline of the transformations. For example:
Normal size--drink potion--become small
Small--eat cake--become larger than normal
etc.
Then, have them get in groups and try to create matrices that would create the transformations. They need to be able to back them up. Give them 10 to 15 minutes.
After this, ask them to share their results. (Poster? Write it on the board? Hold up their dry erase board?) They have to convince you that their matrix is better than another group's. (It might be more accurate, it might better account for her change in size in both directions, etc.)
Let there be a debate. Let kids really argue for why theirs is the best. You can decide if they should get time to revise their answers and try again, or if they have to stick with their first answers. (Revisions would encourage kids to learn, assess, and fix!)
From there, I would choose a simple cartoon figure and ask students to perform the given transformations. (Sample worksheet here.) I selected Kirby because he doesn't require much artistic strength to create simple transformations. Also note that the worksheet I made doesn't ask students to draw. If I had better software to create matrices, I might have included problems like that, but I didn't. Some of your more creative students may better show their understanding by drawing various Kirby images to match given matrix transformations.
How to use this as an assessment?
You could use the worksheet above as a quiz (though something requiring artistic ability is not very fair!)
You could also use the video activity as an assessment tool instead of a team project. You would need to create a rubric and more specific directions!


 That being said, I can't be the only "numbers nerd" out there that is constantly doing mental math while working out. Maybe you count your reps when lifting weights and calculate the total pounds you've lifted? Maybe you set a swimming goal and are finding the fractional portion of your workout completed with each length or lap? Maybe you figure out how many hours you'll have to stay on the treadmill to burn that milkshake you enjoyed last night? I know I'm constantly looking at the numbers and doing a variety of calculations. I couldn't help but take a few photos today thinking that the wealth of information included on the screen is invaluable.
 Course: Pre-Algebra, Algebra
 You have 60
seconds. List all of the questions you could answer given the four photos provided.
You have 60
seconds. List all of the questions you could answer given the four photos provided. I can't make this post fit my normal outline. It's just too basic to include in lessons, but too cool not to post or use in some way!


 6:00 Here's what I can give you: Graph paper, rulers, scissors and markers. You have 5 minutes to create your own ACCURATE candy bar. (For your information, the side length ratio is 3.5:6, you can decide if this is helpful for your students, I think it would be, but could make construction challenging!)
 13:00 Next, we need to break the top piece into three smaller pieces. How should we do that? (This is a much easier "cut" since they are clear vertical and horizontal lines.)
 The Giant's Causeway is a natural formation of rocks on the northern coast between Ireland and Scotland. As you can see from the photos, these spires of rock form beautiful polygons, often hexagons, but reports are anything from quadrilaterals to nonagons.
  For this reason, I feel the EQUATE model is a perfect opportunity to explore these photos and this location. Rather than focusing on a single grade, I encourage you to use the EQUATE thinking routine to apply appropriate standards at your grade level.

 Here's the thing: I think that in order to create TRUE mathematicians, kids need to "wonder mathematically" much more often. Sure, they might laugh at the joke, but do they ever "wonder" what those numbers actually mean? Do they have any number intuition? Can we GET kids to wonder mathematically? My EQUATE thinking model asks kids to do just that. Unfortunately, I'm not sure that this is cut out to be an EQUATE type of problem.
 Standards: 4.NBT.1, 4.NBT.5, 4.NBT.6, 5.NBT.6

 Personal Reflection:


