Showing posts with label 7th Grade Standards. Show all posts

Sunday, August 17, 2014

Pancake Proportions

Personal Reflection:
I'm looking down the road a few weeks to when my 7th grade class begins a long haul with Ratios and Proportions.  (Stretching and Shrinking, Comparing and Scaling for those using the CMP books!)  It makes sense that we will spend a lot of time on this unit because it's what the CCSS emphasize as the fundamental skills in 7th grade, and what we should build all 7th grade learning around.  For that reason, I suspect many of my posts in the next few weeks will be around proportional thinking.  (And I'll be going back to some of my others, such as the FitBit post, the Treadmill post, etc.)

We participate in the BIC program, Breakfast in the Classroom, so I can't make this one a hands-on activity, but I would sure LOVE to.  I'm finding that BIC (while I support it in theory) is going to force me to change my style of "bribing" kids to get engaged because of all the food I like to incorporate.  :)  Anyway, here we go!

Grade Level: 6-8

Course: Math, Pre-Algebra

Standards:   6.RP.1, 6.RP.2, 6.RP.3, 7.RP.1, 7.RP.2,

SMP: MP1, MP2, MP3, MP4, MP6
Skills:Writing ratios, analyzing ratios, analyzing proportional relationships, solving proportions, using proportions in the real world, solving for missing values using proportions


How to use this as a mad minute:
I've taken to noting that each of these not only depends on the amount of time you are willing to commit to a given activity, but also to note the proficiency level of your students.  I say this because I'm working with a population of students that is causing me to shift my thinking about what a "warm up" might look like, due to lower levels of proficiency, language challenges, etc.  For a quick check in, 60 seconds or so, I would ask:
  • What is the unit rate for mix, milk and eggs for 1 pancake?

How to use this as a warm up:
The above question would also work well for a warm up, if that is the skill you've been working on.  However, I might ask the students to find the ingredients needed for a simple number of pancakes in order to highlight proportional reasoning and multiplicative relationships:
  • How much mix would I need for 28 pancakes?
  • How many pancakes would 6 eggs make?  What about 7 eggs?

How to use this as a mini-lesson?
As you may have discovered reading other posts, I usually find images that catch my eye because I am skeptical.  So my first thought was, does it make sense for this box of pancakes to make that many pancakes?  Is this truly in "scale" or proportion?  I would ask my students, is this in proportion? If so, how many cups does the entire box hold?
  • Note, I don't think it is!  If we use the eggs as a guide, the recipe is scaled by a factor of 9, but 9 times 1 cup is 9 cups, which is not 3Q.  (A great way to work on unit conversions!  Have you seen the "big G" conversion chart?  I love it!)  (Here's one place I found the image.)
  • If we also use the factor of 9, the box would contain 18 cups of mix, which I would assume is more of a "Costco" size box, not what we see here.
  • Finally, a scale factor of 9 would make only 126 pancakes, not 155. 
  • If we use the milk as our guide, the SF is 12.  That would mean we need 24 eggs and 24 cups of "mix".  That should also make 336 pancakes.    Hmmm.....

How to use this as a full lesson?
I don't think this could be used as a full lesson, but it depends on your students.  If you choose to use it, I would extend the warm up and mini-lesson into a full discussion AS WELL as setting aside time for students to present rebuttals and/or corrections to the "recipe."  A great interdisciplinary connection would be having the students write the company (can we tell which company this is based on the colors?  I think so.) with their discoveries.  I suspect that the company might respond with some coupons or other "swag"!!

How to use this as an assessment?
Any one of the questions listed above would be perfect to use as an exit slip, a mini-quiz or an assessment question!


Please feel free to use any of these ideas and modify them to meet your needs.  However, please acknowledge the original source of the items and my own lesson outlines.  ©NatalieRSprigg 2014


Saturday, August 16, 2014

Marketing Percent Blunder

Personal Reflection:
As I stated in my previous post, I'm seeking relevant, engaging percent problems for my students.  Earlier this summer I received an email advertisement from a company that I frequent.  (Who doesn't love amazing balsamic vinegars and olive oils??)  However, my "mathematician brain" quickly targeted the 60% off claim.  I was so disappointed that my $21 bottle of olive oil was STILL $13.  Something smells fishy.  :)  I think my kids should talk about this one!

Grade Level: 6-8

Course: Math, Pre-algebra

Standards:   7.RP.3

SMP: MP1, MP2, MP3, MP6
Skills:  Solving problems with percents, finding percent increase, analyzing and interpreting mathematics.

How to use this as a mad minute:
There are a variety of questions I'd ask students to consider for 60 seconds or less:
  • What is the difference between paying 60% of an item's cost and a 60% discount?
  • Which of those would you use if advertising a 60% savings?
  • Can you estimate the cost if you were saving 60% on the advertised bottle of olive oil?  (Note:  I use estimate because I want students to round the price and use mental math, not calculators on such an estimate!)
How to use this as a warm up:
This question feels a bit more like a warm up than a sprint.  A few more minutes to consider the phrasing, the numbers, and the claims.  If your students are proficient or nearing proficiency with the skill of percent discounts, they should be able to attack this independently.  I'd simply ask, "Do you agree with this ad?  Why or why not?"

How to use this as a mini-lesson?
I like the "Mini-lesson" feel of this ad more than anything.  I know that we'd need more than 5 minutes for this conversation, but not nearly an entire class period.  We use Connected Math at my school and this feels like a great "Launch" into other explorations of discounts.  Some questions I'd ask in a mini lesson:
  • Use the warm up questions.
  • Using the two prices provided, find out what percent you PAY of the original.
  • Using the two prices, find the percent DISCOUNT off the original.
  • What do you think of the claims made here?
  • What math might the owners of this business have done to get to their conclusion?
  • Can you create a more accurate ad for this business to use?

ALSO, if you have technology readily available in your classroom, I would use it to have the students "draft a response" to this advertisement email.  This will increase their literacy skills, their communication skills, and their skills at justifying their mathematical thinking.  Plus, it's a great civics lesson to work with community members to keep informed.

How to use this as a full lesson?
If this were your students' first introduction to percents, percent change, and discounts, I can see how the exploration of these relationships using this problem might last a whole hour.  My advice for such a lesson is to really scaffold the instruction and questions to help guide students to the realization that this may not be accurate.  Of course, this depends on the culture of your classroom, the instructional strategies you use, etc.

A quick outline of what I might try:
  • Show the ad, explain that "mathematicians wonder mathematically" and we might wonder if this is accurate.  We are going to build our skills so that we can analyze this ad successfully.
  • Start with the meaning of percent, how to find a percent given two numbers.  Do some samples.  3/5 is 60%, 2/8 is 25%, etc.  Talk about the meaning of those percents.
  • When they see an ad that says 25% off, what does that mean?
  • What does "off" mean mathematically?
  • If we know how to find 25% of a number, how do we find 25% OFF of a number?
  • If we are taking 25% OFF, what % are we paying?
  • What's another way to find the cost?  (Find 75% OF the number instead of 25% OFF)
  • What's the difference between PAYING 60% and SAVING 60%?
  • Show the ad again, and ask them to figure out if the ad is accurate.
How to use this as an assessment?
If your students are ready for an assessment, they are ready for this.  Simply ask them if the ad is accurate and why!  :)


Please feel free to use any of these ideas and modify them to meet your needs.  However, please acknowledge the original source of the items and my own lesson outlines.  ©NatalieRSprigg 2014

Delicious Percents

Personal Reflection:
It's that time of year!  We started 7th grade off this year with a quick and dirty unit on percents.  It's my first time teaching 7th grade in 11 years, and this is a completely different population than I last taught.  The standards have changed, the expectations have drastically increased, and I'm desperately searching for ways to engage the students in real-world mathematics.  So, as I look for real world applications of percents, I found this "draft" post I started ages ago.  Perfect for my lesson this week on percent increase!

Grade Level: 6-8

Course: Math, Pre-algebra

Standards:   7.RP.3

SMP: MP1, MP2, MP3, MP6
Skills:  Solving problems with percents, finding percent increase, analyzing and interpreting mathematics.

How to use this as a mad minute:
Depending on the performance/experience level of your students, you may be able to accomplish a successful analysis of this problem in 1 minute.  If so, I would simply ask, "If a normal package contains 1 bar, and the new package contains 2 bars, is that a 200% increase?  Why or why not?"

How to use this as a warm up:
The only difference in how I would use this as a mad minute, warm up or mini-lesson is in the amount of time it would take for students to successfully analyze, interpret, and debate the reasoning in the ad.  If your students are nearly proficient with this skill, they should be able to tackle this in a 5 minute warm up.

How to use this as a mini-lesson?
As outlined above, students who are not yet proficient may need up to 20 minutes to talk through the fundamentals of percent of change, percent increase, etc.  I know that my students will need about 15 minutes to thoughtfully and successfully approach this problem.  Here is my sample "script outline" that I plan on using this week with my students.
  • Mathematicians "wonder mathematically" and analyze the world around them, thinking about mathematical claims they see.  
  • Here is one such example.  (Review the claim of the ad.)
  • What do we already know about percent change, or percent increase?
    • We know that we need to find the amount of change
    • We know that we need to find the original amount
    • We know that we need to divide to get a decimal.  
    • We know that we need to convert our decimal to a percent.  (Alternatively we could find an equivalent fraction with a denominator of 100 in order to find a percent.)
  • Knowing how we find percent increase, analyze this advertisement and prepare a short response (rebuttal, if your students can handle the vocabulary) regarding their mathematics.
  • (Have students share out.)

How to use this as a full lesson?
I do not think this would warrant a full lesson in most classrooms.

How to use this as an assessment?
I would DEFINITELY incorporate this as a question on an assessment once I'd reviewed these skills with my class.  It's not too sophisticated to "mystify" students in an assessment setting.  Just remember to push your students to think this way and develop such arguments PRIOR to the assessment!  :)


Please feel free to use any of these ideas and modify them to meet your needs.  However, please acknowledge the original source of the items and my own lesson outlines.  ©NatalieRSprigg 2014


Friday, April 25, 2014

Frozen Equations


Personal Reflection:

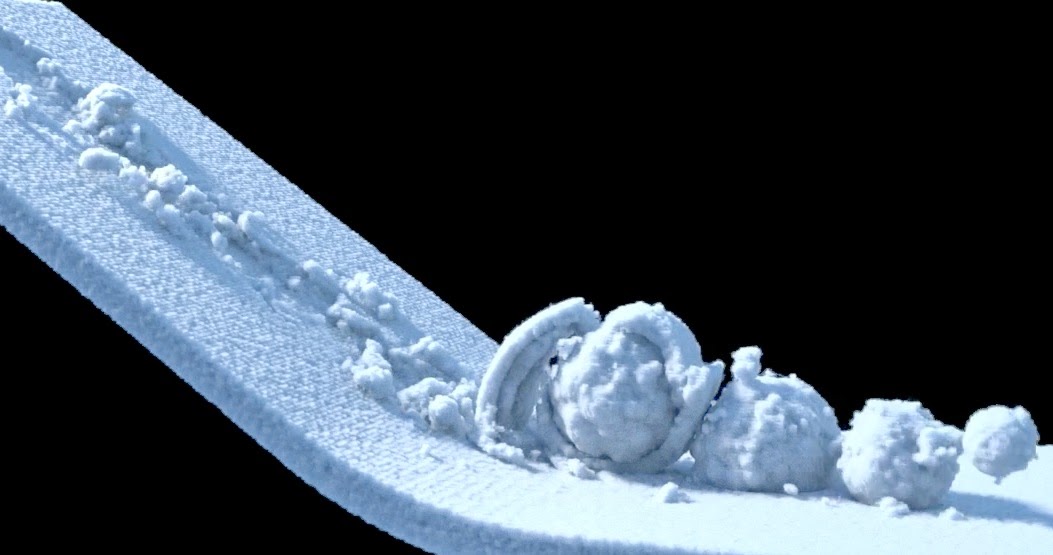
If you are an educator, you've probably been using Pinterest for a few years.  In fact, you probably found this post through Pinterest!  I'm fairly certain I found this image on Pinterest, but possibly on one of my other regular "fun" sites such as 9gag.com.  In an attempt to track down the original, I found this site.  It is not where I got the image, but it is a nice connection to the world of CGI and more detail about the snow effects in Frozen!

The site, linked above, has this amazing introduction, 
"Snow is a challenging natural phenomenon to visually simulate. While the graphics community has previously considered accumulation and rendering of snow, animation of snow dynamics has not been fully addressed. Additionally, existing techniques for solids and fluids have difficulty producing convincing snow results. Specifically, wet or dense snow that has both solid- and fluid-like properties is difficult to handle. Consequently, this paper presents a novel snow simulation method utilizing a usercontrollable elasto-plastic constitutive model integrated with a hybrid Eulerian/Lagrangian Material Point Method. The method is continuum based and its hybrid nature allows us to use a regular Cartesian grid to automate treatment of self-collision and fracture. It also naturally allows us to derive a grid-based semi-implicit integration scheme that has conditioning independent of the number of Lagrangian particles. We demonstrate the power of our method with a variety of snow phenomena including complex character interactions."
Wow.  That's technical.  In my own words?  "Snow is hard to animate.  While past methods worked fairly well, wet and dense snow was challenging because it acts like both a solid and a fluid.  In order to address this, engineers created a model that uses two different geometrical methods to animate snow.  They are able to use a Cartesian coordinate grid, along with programming, to simulate how snow both gathers (forms snowballs) and breaks (falls, hits, etc).  This sounds SO advanced, but I believe the analysis is totally approachable by a typical middle school student.  This is why I snagged the gif above and saved it, knowing that it would give some concrete meaning to students who are interested in the use of variables AND scientific notation!

Grade Level: 6-8

Course: Math, Pre-Algebra, Algebra

Standards:   6.EE.6, 6.EE.9, 7.EE.4, 8.EE.4

SMP: MP1, MP2, MP3, MP4, MP6, MP7, MP8
Skills: Variables, Algebraic Reasoning, Scientific Notation


How to use this as a mad minute:
You'll definitely need to preview this and explain the basics to the students.  However, after a short intro, a 1 minute number sense and reasoning check in might look like:

Compare the top two expressions carefully.  When you identify the difference in the expressions, and the subsequent snow fall, describe how you think the change in the scientific notation changes the snowfall.

How to use this as a warm up:
Again, after an intro, so students understand what this gift shows and where it comes from, I would challenge them to work with a partner to try to define what each "variable" controls, and how the change controls it.  (Hint:  It might be useful to name the snow fall quadrants A, B, C, and D in order to know which is which.  I will use A in the upper left and rotate clockwise through.)

A sample answer might be, "The equations on the right have ThetaS of 7.5 x 10^-3 and the snow is noticeably more clumpy or less-liquid than those on the left." (There are several comparisons they could make, so don't stop! Also, I would recommend you DON'T provide this example to the students prior to them working and struggling, it will be more productive that way!

How to use this as a mini-lesson?
I would start the same way as above, but prepare extension questions for students.  The exploration I outlined above, might only take 5 minutes, but a 20 minute mini-lesson could easily flow.
First, I would encourage students to share out, and convince others of their observations.  This is a great way to work on descriptive language, choosing appropriate adjectives, and talking about scientific notation.

To push students further, I would ask them to try to create their own equation that merges some of the changes.  Then challenge them to describe the resulting snowfall, and possibly even illustrate the final image.

How to use this as a full lesson?
Continuing on the trend above, I would then push students to explore more independently.

If your classroom has technology, I would visit the site:  http://www.cgmeetup.net/home/making-of-disneys-frozen-snow-simulation/ and have the students watch the video.  Another option would be for them to find a clip of the movie online and try to match which of the four quadrants a particular scene might be using.

This is another video of how artists used mathematics in creating the imagery in the movie Brave.

Depending on your focus, you may push students to analyze the scientific notation.  How big are these numbers?  What does that tell you about the size of the changes?

A great reading extension is this article from The New York Times about the Columbia University mathematicians who are working with film studios to enhance their computer graphics.

How to use this as an assessment?
I would not use this as an assessment, as it's probably a student's first exposure to this type of analysis.  However, if you've provided similar learning experiences for students, the Warm Up lesson is probably an opportunity for authentic assessment and analysis.


Please feel free to use any of these ideas and modify them to meet your needs.  However, please acknowledge the original source of the items and my own lesson outlines.  ©NatalieRSprigg 2014


Monday, July 1, 2013

FitBit Math

Personal Reflection:
I have a FitBit.  This is a Fitbit Zip, the smallest and most basic of the systems.  It clips on to your waistband, pocket, bra or shirt and tracks your steps.  I assume, based on the info you provide when you set up your online account, it then translates that movement into a distance traveled and a number of calories burned.  (This post will give your students a chance to explore whether or not this is true!)

Anyway, we've all heard that a goal of 10,000 steps a day is a great way to increase movement and to stay healthy.  How far is that?  How many calories does that burn?  Is that consistent?

As you know, I do a lot of thinking about "how much I have left" when I'm working out.  This is similar to my treadmill post, but slightly different.


Grade Level: 6-7

Course: Pre-Algebra, 6th and 7th grade math

Standards:  6.RP.1, 6.RP.2, 6.RP.3, 7.RP.1, 7.RP.2, 7.RP.3
SMP:  SMP1, SMP2, SMP3, SMP4

Skills: Ratios, Proportions, Unit Rates, Problem solving, Real world problems

How to use this as a mad minute:
You have 60 seconds. Estimate the number of steps someone takes in one mile.

How to use this as a warm up:
You could ask the students to consider one of the following:
1.  What is the relationship between steps and distance?
2.  What is the relationship between steps and calories?
3.  What is the relationship between calories and distance?
4.  Estimate the number of steps you would take in 10 miles.
5.  Estimate how far you would have to walk (either in steps or in distance) to burn off a large McDonald's French Fries.  (500 calories.)

How to use this as a mini-lesson:

0:00--I'd like you to take 60 seconds to brainstorm everything you know about ratios or proportions.
1:00--Partner up and share your ideas with a partner.  Make sure to add anything you forgot to your list!
2:00--Can we make a list of properties of ratios and proportions and define them?
4:00--I'm going to show you three photos.  (Link here.) When you look at them, don't talk to your friends, but take a minute to write down your immediate "math wonders" about the photos.
5:00--Take a second to reflect.  Are your questions mathematical?  Are you focused on applications of math and not off-topic?  If so, please share them with your partner.  When both have shared, select two questions you feel are your "best" and write them on the board.
7:00--Here you will want to zoom in on the most relevant and appropriate questions.  I suspect that several will be able to be answered through solving proportions.  Feel free to "prime" groups as you observe to encourage them to think proportionally.  I will post "pretend" questions for the remainder of the lesson based on what I would expect kids to "wonder" about.  It looks like we have a lot of questions about the distance and the steps!  Do you know what a "unit rate" is?  Think about this, if you can buy 4 candy bars for $1, how much is each candy bar?  (Allow time.)  Finding the cost for one candy bar is the UNIT rate, how much for 1 of that thing.  I think we are wondering how many steps for 1 mile.  Can you set up a proportion that shows steps compared to distance? 
9:00--How could you change that to find out how many steps are in 1 mile?  (This assumes previous knowledge of solving proportions.  If I were introducing the skill for the first time, I would have spent at least a class period on setting up equivalent fractions and observing/discovering the property of cross products being equal.  Kids should know how to set up a proportion with a missing value.)  
10:00--Please solve your proportion and determine how many decimal places you need.  When are done, discuss with a partner and come to an agreement. 
12:00--(Discuss the answers as a class.  The exact answer, rounded to the nearest hundredth is 2148.22.  I rounded here because the next two places are zeros.  However, I would round to the nearest whole step, or even to the nearest ten.)  How did you solve?  Why?  How can you be sure that makes sense?  How did you round?  Why?  How can you be sure that is reasonable?  (Choose two students who rounded differently and ask them to explain.  I hope someone would note that 2150 is much easier to use in long term estimating than 2148 or 2149.22, I also hope someone would note that 2148 is easier than 2148.22 and there is no such thing as .22 of a step.  Finally, I hope someone would note that 2148.22 is the exact value and that the extra decimals are negligible.) 
14:00--Can you repeat this magic?  Can you tell me how many calories I'll burn in an hour?  Or how many steps it takes to burn 100 calories? 
16:00--Are both of the questions I asked Unit Rates?  Why or why not?  Be prepared to back up your answer!
17:00--Who thinks they are?  Who thinks they are not?  (Hold a mini debate, or allow students to change sides of the room.  Revisit the definitions you established if there is still a question at the end of your "debate".)
19:00--Can anyone, after looking at these examples, think of a time when they might solve a proportion to answer a real life question?

How to use this as a full lesson?
I always recommend extending the mini-lesson into a full lesson with further exploration.  First, I wondered if the FitBit readings and unit rates would differ for a different person.  I had to enter my height and weight in the online program when I registered, so I asked another user to share a few screen shots of HER FitBit.  Adding this second set of data opens another opportunity for exploration and extension.  For example, are the unit rates the same?  If not, what can you tell about each person's rates?  Can you graph the data?  Can you compare the two sets on a single graph?  Will one person "go farther" with the same number of steps or burn more calories with the same distance?  This is a great introduction to slope!  Slope is a rate of change, or a relationship between two numbers, just like a proportion!  Even if you don't calculate the unit rates for the second FitBit, you could definitely have students graph the data (assuming both started at 0,0,0) and talk about what the slope represents.  What does a steeper line mean in this real life situation?

I included both sets of FitBit data on FitBit Worksheet 2.

How to use this as an assessment?
If your students are proficient with unit rates, it would be perfectly reasonable to provide the FitBitMath1 or FitBitMath2 worksheets and ask them to calculate unit rates and explain the meaning of their answers.  Short, simple, effective.


Please feel free to use any of these ideas and modify them to meet your needs.  However, please acknowledge the original source of the items and my own lesson outlines.  ©NatalieRSprigg 2013 

Sunday, June 23, 2013

Summer on Uranus

Personal Reflection:
This is another photo from uberhumor.com.  I find that this site, though not always student-appropriate, does have a mix of "items" that often lend themselves to discussion and exploration.

This is a pretty simple fact.  It is easy to research the accuracy of this fact and determine that if the orbit of Uranus around the sun is 84 years, then "summer" or 1/4 of that time, would be 21 years.  But to me, there's so much more to ask and so much more to explore.

This is also an ideal way to encourage students to use background knowledge to build a "case" for the accuracy of this fact and then confirm their answers electronically.

Note:  As a special addition below, I included some ideas for interdisciplinary connections!

Grade Level: Middle School 
Course: Pre-Algebra 
Standards:  Science:  5-8 Standard D, 9-12 Standard B  (Though math is involved, I don't think this relates to specific standards.) 
SMP: SMP.1, SMP.2, SMP.3, SMP.6, SMP.8

Skills: Critical thinking, research, questioning, Algebra, Computation


How to use this as a mad minute:
You have 60 seconds. Outline your immediate reaction to this and back it up with either scientific or mathematical knowledge.

How to use this as a warm up:
You could ask the students to consider one of the following:
1.  If "summer" on Uranus lasts 21 years, what do you know about it's period of rotation about the sun?
2.  Based on what you know about Uranus, what do you think "summer" looks and feels like?
3.  The Earth is tilted on its axis by 23º.  Uranus is tilted by 82º.  What does that tell you about seasons on the planet?
4.  The length of a day on Uranus is -0.718 Earth days.  What does the number tell you?  What does the negative mean?

How to use this as a mini-lesson:
Given 20 minutes, I would focus on discovery, exploration, and discussion.  For this mini lesson students will need access to the internet.
0:00--Let's look at this image!  (Show the graphic.)  Take a minute to think about it and discuss your immediate reaction with a friend.
1:00--What did you see or say to your partners?
2:00--Let's brainstorm.  What do you already know about seasons, Earth and Uranus?  Talk with a partner, write down everything you can think of, you have two minutes!
4:00--Partner up with another group and share your lists.  Add anything you don't have on your own.  Put a ? mark next to anything you are unsure about or disagree with.
5:00--Repeat combining two more groups.
6:00--Let's share out what you know!
8:00--Let's share items you were unsure of or to which you put a ? mark.  (Remember, you don't want them to ask, "Is this true?" just yet.  This is a valid question, but we are trying to build and confirm background knowledge.  Students WILL check out the validity of this number, but not quite yet.  Explain to them that they can answer this question shortly, but we are focusing more on things like, "Seasons are caused by the tilt of a planet on its axis." or "Uranus is tilted much more on its axis."  These are items that will help students answer the question on their own, eventually.)
9:00--You are going to have 3 minutes.  I want you to research anything you listed EXCEPT the length of summer on Uranus!  Make sure you find valid sites and make sure you document your sources!
12:00--Everyone had different questions.  Did everyone find their answers?  Were there any questions you were unable to answer?  Can anyone help them or tell them the answer?
14:00--Let's see if you can use your knowledge to answer the following questions.  I'm going to ask 2 questions and then give you and your team 3 minutes to answer them.   You should NOT use the Internet to answer.  1.  If summer is 21 years on Uranus, how long is a year?  2.  Does the length of summer (or a year) relate to how big Uranus is or how far away it is from the Sun? 
17:00--Confirm your answers using any resources you prefer!
19:00--So this simple graphic is TRUE!  Awesome!  What other questions would you like to explore now that you've seen this?

How to use this as a full lesson?
I really feel this is ideal for an EQUATE Lesson.  (Click link for explanation.)

I can see the students wanting to know if this is true, but that is far too simple and can be answered easily by Google.  It will require some fantastic questioning strategies from the teacher to guide students to more challenging or deep questions.  Off the top of my head, I would want to explore the following questions:
  • Which planet has the longest and shortest "summers"?
  • Which planet has the longest and shortest days?
  • Does the size of the planet relate to the length of the "summer" or "day"?
  • Do other planets have seasons like summer?  Why or why not?
  • What does "summer" look like on other planets?  (For example, Earth is tilted on its axis as it rotates, creating seasons, but other planets are not tilted or are tilted nearly 90 degrees, this causes great variation.  Also, gas planets don't heave "seasons" in the same way as others, and in some planets, though the temperatures vary, there's not what we would consider a season!)
Please note:  Some of my questions seem basic, but, as any good teacher knows, the depth is in the WHY? So don't forget to ask!

I found this site to be useful.  (NASA--Planetary Seasons)

How to use this as an assessment?
I don't feel this is appropriate for an assessment.  (You may feel otherwise and of course, feel free to use it!)

Interdisciplinary Connections
Ray Bradbury's short story "All Summer In A Day" is a great connection.  However, it can be a bit disturbing and you should definitely preview it before using it with students.

There is also a short (30 min) movie version of "All Summer In A Day"

I would definitely work with your team to, perhaps, have students read the story, watch the movie, research seasons on planets and, it's up to you, then assess their understanding.  My first thought is to separate students and hold a debate about how accurate the story/movie are, and whether or not this is a fair representation.  Students would need to back up their arguments with scientific evidence about the seasons on various planets as well as other items of "accuracy" such as life on another planet.


Please feel free to use any of these ideas and modify them to meet your needs.  However, please acknowledge the original source of the items and my own lesson outlines.  ©NatalieRSprigg 2013 

Wednesday, June 12, 2013

Infinite Chocolate

Personal Reflection:

This was one of the first images I've seen in a long time that inspired me to actually investigate and try to explain what was happening.  I didn't just try to use logic, reason, estimation, etc.  I actually got out graph paper, scissors, tape and MADE a paper chocolate bar.  If it can inspire me to build and play, I'm sure it will do the same for students.

I got this gif from this site.

Grade Level: 7-10

Course: Algebra

Standards: 7.G.1, 7.G.4, 7.G.6,G-CO.6, G-CO.7, G-CO.12, G-MG.1, G-MG.3
SMP:  SMP.1, SMP.2, SMP.3, SMP.4, SMP.5, SMP.6

Skills: Geometry, Area, Constructions, Modeling, Problem Solving, Ratio, Proportion, Scale

How to use this as a mad minute:
You have 60 seconds. Give me one reason you think this DOES or does NOT work.

How to use this as a warm up:
You could ask the students to consider one of the following:
1.  What is the area of the original chocolate bar in generic "units"?
2.  What is the area of the new chocolate bar in generic "units"?
3.  When the candy bar is broken up, there are 5 pieces.  Describe each piece using a correct geometric name and explain what properties each piece has to categorize them.
4.  Draw the 5 pieces on your paper (sketch!) and then label the angles.  (Acute, obtuse, right, straight.)
5.  What is the perimeter of the original candy bar?  Is the final perimeter the same or different?

How to use this as a mini-lesson:
Please note:  I included screen shots of the candy bar when it isn't moving for YOU to use, but largely, it would take away some mystery for the kids, so I probably would NOT show the photos to them.


0:00  Look at this awesome gif!  Have you seen this online?  If so, what did you think?  Watch and then turn and discuss with a partner.
1:00  If you haven't already discussed with a partner, focus on whether or not you think this works and why.
2:00  Ok, let's talk.  Who thought it worked?  Who didn't?  Why?
4:00  How could you prove your side?  What would you do?  (If they don't know, gently guide them toward making their own model)  What supplies would you need?  What information would you need?
6:00  Here's what I can give you:  Graph paper, rulers, scissors and markers.  You have 5 minutes to create your own ACCURATE candy bar.  (For your information, the side length ratio is 3.5:6, you can decide if this is helpful for your students, I think it would be, but could make construction challenging!)
11:00  Now that you have this candy bar, you want to "break" it accurately.  How could you "cut" this candy bar accurately?  (The bar, if students watch carefully, is cut on a diagonal from 1.5 "squares" up on the left through 1.5 "squares" down on the right.  But I would encourage kids to measure angles as well.) 
13:00  Next, we need to break the top piece into three smaller pieces.  How should we do that?  (This is a much easier "cut" since they are clear vertical and horizontal lines.)
15:00  Finally, we need to take out the extra square.  (I would have the kids label the pieces either by number, letter, or size.  I'll call them "single", "double", Small, medium and Large for my explanations.)
16:00  Now slide your medium piece up and your small piece over and down.  Fill the gap with your double piece.  Discuss what you see with your partner!
18:00  What did you see?  How do you explain the extra piece?  (Hopefully they see that the "squares" are not the right size or dimensions and to get them to "line up, the students need to shift the small and medium pieces "up" a bit leaving a long thin "gap" between the top and bottom.  Almost like the photo to the right.)
19:00 Does your extra piece "fill the gap"?  Is this real "infinite" chocolate? Why or why not?

How to use this as a full lesson?
I would definitely use the mini lesson above, allowing for more freedom if students are enjoying the exploration and discussion.  Depending on the grade level I would also ask appropriate questions and use appropriate vocabulary.

For example, if you repeated this experiment without the "squares" of chocolate and one large bar, could you prove congruence?  Why or why not?  If you can prove congruence, explain the criteria for congruence and back up your answer mathematically.  If not, what mathematical proof (not just modeling) could you use to justify why these are not congruent?

Why are the "small" and "Medium" pieces NOT similar?  Use definitions, properties, and measurements to back up your claim.

What is the ACTUAL area of the original?  What is the actual area of the final candy bar (minus the extra square)?  Does this prove that they are or or not congruent?

After these explorations, I would show the video linked here.  This is a similar optical illusion, trick, or manipulation.  Encourage your students to watch, either as a class, or on their individual devices.
I apologize in advance for the ad that precedes the video, but you can skip it after 5 seconds. 


I would ask students to watch out and consider these questions as they watch:
What are the original dimensions?
What is the original area?
What do you notice about the space in the "box" as he shakes it?
What do you notice about the cuts of the pieces?
What do you notice as he lays out the tiles the first time?
As he moves them, what do you see?
As he places them back the box what do you see?
As he "repeats" or "reverses" the trick, what do you see?

Can you explain his "trick" mathematically?

Use your number sense.  (I think you can see more "wiggle"room once the 3 squares are removed, and 3/63 is such a small percentage of change, it's not too obvious.  Add to that the fact that he has a very hard time at the end of the video making them all fit again!)

Ask the students to justify, model, draw, explain, etc.  They should use correct mathematical vocabulary, appropriate skill and relationships to their learning.  For example, can they discuss area and congruence?  Can they name shapes and angles?  Can they formally prove or disprove congruence?

How to use this as an assessment?
To use this as an assessment, I'd do the mini lesson at the beginning of a unit, refer to it throughout the unit as we are using vocabulary and talking about proof, and then I would show the video at the end.  I would assess the students on their explanation of the "trick" and how well they used what they had learned.

You would definitely want to create your own rubric before the assignment.  You would also want ample supplies for students, as well as multiple devices, as students will want to watch the video over and over as they work.  (Isn't it awesome that the video is nearly silent??)

Please feel free to use any of these ideas and modify them to meet your needs.  However, please acknowledge the original source of the items and my own lesson outlines.  ©NatalieRSprigg 2013 

Wednesday, June 5, 2013

Giant's Causeway

Personal Reflection:

One of my most favorite places in the whole world (that I've never actually been to) is The Giant's Causeway in northern Ireland.

The summer after college I was a nanny for my cousins in a small town outside of Dublin called Dunboyne.  I was too young to get my Irish driver's license and ended up taking the kids to the city on the bus.  We did get to take weekend trips with the family to southern Ireland, but while I was there there was just too much unrest to visit up North.

Thus, this is the most amazing place in the world that I've always wanted to go to, but never have.  :)

The Giant's Causeway is a natural formation of rocks on the northern coast between Ireland and Scotland.  As you can see from the photos, these spires of rock form beautiful polygons, often hexagons, but reports are anything from quadrilaterals to nonagons. 

This, to me, is full of opportunities for great instruction.  I can see anything from estimation and basic polygon identification (3rd Grade) to tessellations and transformations. 

For this reason, I feel the EQUATE model is a perfect opportunity to explore these photos and this location.  Rather than focusing on a single grade, I encourage you to use the EQUATE thinking routine to apply appropriate standards at your grade level.

Grade Level: 3-HS

Course: Math, Pre-Alg, Algebra, Geometry

Standards:  3.MD.8, 3.G.1, 3.G.2, 4.MD.5, 4.G.1, 4.G.2, 4.G.3, 5.MD.5, 5.G.3, 5.G.4, 6.G.1, 6.G.2, 6.G.3, 6.G.4, 7.EE.3, 7.EE.4, 7.G.1, 7.G.6, 8.G.1, 8.G.2, 8.G.3, 8.G.4, G-CO.1, G-CO.2, G-CO.5, G-CO.6, G-CO.7, G-GPE.7, G-GMD.2, G-GMD.3, G-MD.1, G-MD.3
SMP: MP.1, MP.2, MP.3, MP.4, MP.5, MP.6, MP.7, MP.8
Skills: Estimation, Number sense, reasoning, modeling, geometry, geometric shapes, properties of shapes, area, perimeter, volume.


How to use this as a mad minute:
You have 60 seconds. Name all of the shapes you can see.

How to use this as a warm up:
You could ask the students to consider one of the following:
1.  Name the shapes you see.
2.  Does this fit the definition of a tessellation? Why or why not?
3.  Are these "regular" polygons?  Why or why not?

How to use this as a mini-lesson:
If I only had 20 minutes, I would use technology to explore this VERY COOL region.  This website has an awesome interactive map, some history, and the legend of the Giant's Causeway.

http://www.voicesfromthedawn.com/the-giants-causeway/

How to use this as a full lesson?
As I mentioned before, I feel that this is an ideal EQUATE lesson.  Although there is a ton of math that is obvious to an instructor, this captivates my interest because of the combination of legend, scientific history, and visual appeal.  I feel your students will also be drawn to these elements.  If you are comfortable, let the students dictate the direction of the lesson and exploration (within reason).

I would show these photos, let the students explore, discuss, etc.
Then I would list all of their questions, encouraging them to "wonder mathematically" about them.
Focused on grade-level appropriate standards, I would ask students to narrow down the questions to make sure they are relevant to things you have already explored or discussed in your class.
I would let the students ask YOU questions and you can provide the answers you feel are appropriate.  (How are they formed?  How big is the region?  How many are there?  You can provide as much or as little information as you wish.)
I would settle on a question (or two or three) for your students to apply their knowledge and continue to try to solve.  Encourage them to TRY something!  Draw on the photo, measure it, get online and do research, look up formulas that might be useful, gather information, start playing with the numbers, rules, formulas, photos, etc.
Finally, ask the students to Explain what they did, what they found, and how they approached the problem.

 How to use this as an assessment?
It is up to you if you think your students can use this as an assessment appropriately.

It could be something as simple as providing the first photo and asking students to outline as many different shapes as they can see and explain why they are different and what they are (Elementary School).

It could be more advanced, offering the size of the region, the size of an individual "step" and asking the students to estimate how many are in the entire region.  (Upper Elementary to Middle School.)

You could ask the students to find two similar "steps" and justify why they are similar (Middle/High).

You could ask the students to find the volume of two or three different "steps" and justify their solution methods.  (Middle/High).

You could ask the students to PROVE that two items are congruent or similar based on transformations such as rotations, reflections, etc.

Works Cited:
Photo 1
Description: Giant's Causeway and Causeway Coast
Copyright: © Philippe Croo
Author: Philippe Croo
Image Source: Philippe Croo  (Link)

Photo 2
http://farm3.staticflickr.com/2755/4427445338_7869405855_z.jpg?zz=1

Photo 3
https://garystravel.wordpress.com/page/107/


Please feel free to use any of these ideas and modify them to meet your needs.  However, please acknowledge the original source of the items and my own lesson outlines.  ©NatalieRSprigg 2013 

Sunday, June 2, 2013

Life's Complex Plane


Personal Reflection:
I love when someone, more creative than myself, is able to combine really awesome math with really deep thinking. I keep thinking that if we want to create critical thinkers, the people who create these kinds of images are the epitome of critical thinkers.  So...can we get kids to do the same?

Image Source

Grade Level: 6-9

Course: Pre-Algebra, Algebra

Standards:  6.NS.6.b, 6.NS.8, 7.RP.2.a 
SMP: MP2, MP3, MP4, MP7
Skills: Coordinate plane, critical thinking, graphing, analysis


How to use this as a mad minute:
You have 60 seconds. Explain your interpretation of this graph to a partner.

How to use this as a warm up:
You could ask the students to consider one of the following:
1.  If you had to give a title to each axis that would encompass the extremes, what would it be?
2.  Explain the relationships in each quadrant.
3.  Do sleepiness and joy have a direct or inverse relationship?
4.  Do you agree with the 4th quadrant?  Why or why not?
5.  Do you believe that dreams and reality are opposites?  Why or why not?  Use mathematics to back up your argument.

How to use this as a mini-lesson:
I'm going to assume (bad idea?) that you'll use this with kids who are familiar with the coordinate plane, the quadrants and how to read them.  This is not an introduction, but an elevation!  We've got 20 minutes?  Here we go!

0:00--Take 1 minute to read this, analyze it, and think about whether or not you agree with it.
1:00--Now, without talking, take the next minute to jot down your ideas, thoughts, etc.  You can draw, you can write, you can use notes, anything you want.
2:00--Now partner up and compare your thinking.  You have 60 seconds.
3:00--Ok, let's share out some ideas, thoughts and reflections.  What did you see?  Agree on?  Disagree on?
6:00--Ok, I'm interested in seeing if you can create your own "Complex Plane."  Let's start with 60 seconds of brainstorming opposites.
7:00--Let's list those where everyone can see them.
9:00--Ok, here's the challenge.  Take two pairs of opposites and put them on your axes.  (Dry erase boards, math journals, notebooks, etc.)  Now, try to imagine what each quadrant would represent.  (I'm going to include my own example, because it's not as easy as you might think!  First, the challenge is not to be swayed by the previous example.  I kept thinking of joy and sadness, or night and day, which both felt too close to the original.  I chose Hot & Cold and then Starving & Full.  I was thinking of temperatures of food, but without a title, that might not be clear.  Then I had to think, what food would be amazing hot and would make you full?  Not too hard for a high schooler to choose.  Pizza, Pasta, Cheeseburgers could all work.  Next, what would make you full when it is cold.  Ok.  Done.  But what food would you starve rather than eat?  Hot uncooked fish?  What food would you starve if you ate it cold?  That was the hardest.  Mine is not perfect, but it's my first effort.  I recommend you try this yourself several times before you ask the kids to do it!)

10:00, 11:00, 12:00--Check in on kids' progress.  Encourage them to keep going.  Ask them to create more than one if they struggled.
13:00--Let's partner up and share your results.  DO NOT EXPLAIN.  Ask your partner to study yours and then tell you what they think it shows.  Then flip.  You'll have 3 minutes total.
16:00-There is a fantastic website that creates graphical images like this almost every day.  thisisindexed.com.  Examine these two images.  Then try to create your own!

How to use this as a full lesson?
I probably wouldn't.  I think this is an engaging activity that sparks creativity, but is NOT destined for an entire class period.  However, if you wish, you can explore thisisindexed.com and select other images.  From there you can ask students to explain what is happening and to try to create their own.

Another option is for students to explore the site on their own (warning: a few images do pertain to more mature subject matter) and ask them to select their 4 favorites, analyze them and be prepared to explain them.  Browsing will take a lot of time!

 How to use this as an assessment?
I don't feel this is appropriate for a summative assessment.  Formative assessment will take place as you listen to student discussions and explanations.


Please feel free to use any of these ideas and modify them to meet your needs.  However, please acknowledge the original source of the items and my own lesson outlines.  ©NatalieRSprigg 2013

Friday, May 31, 2013

Wonder of Pi


Personal Reflection:

I saw this on 9gag.com and being a numbers nerd (proudly!), I saved it.  I wasn't immediately sure how I would use it.  It's a great way to show the concept of an irrational number never ending. (By the way, could we give a few other numbers credit the same way we give π credit?)  It's also a great way to show the concept of infinity.  We could use this in a geometry unit anywhere from 4th to 10th grades.  And yet, when I thought about it, I decided I'd most love to use this in a probability exploration.    Thus, the activities below are targeted at 7th grade (6th and 8th are statistics years, FYI) and at the high school level.  I will try to put appropriate 7th grade explorations in RED print and high school explorations will be in BLUE print.

Grade Level: 7th & HS

Course: Pre-Algebra, Algebra, Geometry, Prob/Stat

Standards:  7.SP.5, 7.SP.6, 7.SP.7, S-CP.2, S-CP.5, S-CP.6, S-CP.7, S-CP.8, S-CP.9, S-MD.6, S-MD.7
SMP: MP2, MP3, MP4, MP5, MP6, MP7, MP8
Skills: Compound Probability, basic probability, rounding, research, science, decision making, conditional probability, independent probability, frequency table, sample space, probability modeling, data collection


How to use this as a mad minute:
You have 60 seconds. Look at this image.  What are your immediate reactions, thoughts, concerns, celebrations, etc?

How to use this as a warm up:
You could ask the students to consider one or more of the following:
1.  List everything you know about π.
2.  What is the difference between an irrational number and a repeating decimal?
3.  What is the probability of randomly selecting the digit 3 from a set of digits 0-9?  What is the probability of selecting the digit 1 from a set of digits 0-9?  Are the probabilities equal?  Why?
4.  What is the probability of randomly selecting the digit 3, replacing it, and then selecting the digit 1 from a set of digits 0-9?  Is this more or less likely than selecting each number independently?  Why?
5.  What is the probability of randomly selecting the digit 3, replacing it, and then selecting the digit 1, replacing it, and then selecting the digit 4 from a set of digits 0-9?  Is this more or less likely than selecting each digit independently?  Why?

How to use this as a mini-lesson:
As a 7th grade exploration.
Assuming you have 20 minutes with 7th graders who have NO background in compound probabilities, here we go!

0:00--Today we are going to talk about probability.  We only have a short time, so let's agree that we are going to talk about "FAIR" probabilities, no trick coins, spinners, dice, etc.  Given that, what's the probability that when you roll a die, you get a 3?  (Allow for discussion, calling out, etc.)
1:00--Ok, so I heard answers as __________ (fractions?  decimals?  Percents?  All three?  This is where your fantastic impromptu skills come in.  I would guess that students will use a fraction more than any other, mostly because the decimal and percent equivalents are not obvious or easy for them to manage mentally.)  The probability of an event occurring is 

(from mathisfun.com)
So fractions are pretty easy to use when you know the number of 3s on a die and the total possibilities.  Do you all know that you can also write probabilities as decimals and percents?  (Get feedback, determine if you need to use another minute to discuss converting to decimals and percents.)
2:00--Awesome!  Let's do a few more probabilities.  This time I want you to try answering as fractions, decimals AND percents.  Switch it up!  
What's the probability of flipping a coin and getting heads?
What's the probability of being born a girl?
What's the probability of grabbing a marker out of my hand and getting red?  (Hold out 4 markers of different colors.)
(Listen to responses and address accurate and inaccurate answers as well as any concerns or creative answers you need to discuss!  Add your own if you need to, based on what you have around your room.)
3:00--What's the probability of selecting a letter from my last name and it being a ____?  (Using SPRIGG as an example, I'd ask first about the S, the P, the R, the I, and then, the G.  Most answers will be in fractions, depending on how many letters your last name has, which is fine!)
4:00--Let's talk about the possibilities of COMPOUND probabilities.  This is when I ask you something more complicated, like, "Whats the chance I roll a 3 AND flip a coin and get heads?"  Take a moment and write down your guess.  What do you think the chances are that when I flip this coin and roll a die, I get a 3 and Heads?  
5:00--How are we going to figure this out?  We already know the chance of getting a 3 is 1/6 and the chance of getting a heads is 1/2.  So what next?  (Allow for discussion.  Some students may already have learned this, which is a great stepping stone.  List their ideas.  Refer them back to the probability definition above.)
7:00--If we want to know the probability, we need to know the number of outcomes.  Does anyone have a suggestion of how we can figure out the number of outcomes?  
8:00--Ok, grab a partner and you have 2 minutes to try to list all of the outcomes that can happen if I flip a coin and roll a die. (While kids work, write the combinations down.  You can put it on a projector, your dry erase board, on a sheet of paper for a doc cam, etc.  Basically, you don't want to waste time doing it in front of them.  However, you might want to show different strategies, such as a tree diagram, organized lists, etc.)
10:00--How many different outcomes did you find?  (Get feedback. If answers are all over the place, you are going to need an additional one or two minutes for this lesson.  If the answers are very divergent, ask groups to partner with a group whose answer is FAR from theirs and discuss and compare.  Hopefully they will help each other see the best answer (12)!  If they are close to 12, but maybe missed one or two combinations, continue.)  How did you come up with those?
11:00--I did the same thing!  (Show your work.)  I got 12 combinations.  What do you think?  How many of those are combinations that show a 3 and a heads?
12:00--So, 1/12.  We already knew 1/6 and 1/2 for each.  What happened?  Do you think this will happen every time?  Should we try a different experiment?
13:00--What's the chance that I reach into a bag that has every letter in it, and I draw out an "H"?  What about if I replace it and try again.  What's the chance of drawing out an "I"?  Do you want to make these lists?  Can we figure out the probability without making the list?
15:00--Yes, it's 1/676.  I have a 1/676 chance (.15%) chance of randomly making the word "HI" when I draw the letters.  
17:00--Look at this graphic.  read it carefully.  Think about it for a minute on your own.  (Show the π image.)
18:00--Talk about it with your friend.  Based on what you just observed about probability, do you think this graphic is true?  Why or why not?
19:00--It's a fascinating proposal!  If you are interested, this will be on my website so you can investigate further.  I also recommend researching the "Infinite Monkey Theorem" to help you understand what this image is suggesting as well as the probability of it happening.  (Note:  Teachers, the first GOOGLE link to infinite monkey theorem is to the winery.  You may want to offer your own links on your website to avoid any issues.) 


As a 10th grade exploration.
Assuming you have 20 minutes with 10th graders (Any level of high school, really) who have background in compound probabilities, and need a refresher before you jump in, here we go!

0:00--Today we are going to talk about probability.  We only have a short time, so let's agree that we are going to talk about "FAIR" probabilities, no trick coins, spinners, dice, etc.  Given that, what's the probability that when you roll a die, you get a 3?  (Allow for discussion, calling out, etc.)
1:00--Ok, so I heard 1/6 (I hope!)  The probability of an event occurring is 

(from mathisfun.com)
These are independent probabilities.  If you look at the probability of a single even occurring, you can find it by looking at the number of positive outcomes divided by the number of total outcomes.
2:00--What's the probability of selecting a letter from my last name and it being a ____?  (Using SPRIGG as an example, I'd ask first about the S, the P, the R, the I, and then, the G.  Most answers will be in fractions, depending on how many letters your last name has, which is fine!) 
3:00--Let's talk about the possibilities of COMPOUND probabilities.  This is when I ask you something more complicated, like, "Whats the chance I roll a 3 AND flip a coin and get heads?" How many of you have done this in the past?  Do you remember how to do it?  (Discuss and do a quick review.)
5:00--Usually, in lower grades, you list the total outcomes.  You might make a tree diagram, a table, a list, etc.  But you already learned a trick to bypass this step.  It's important, though, to make sure that you are finding all possible combinations.  In high school you are asked to show probability distributions.  This proves that you've accounted for all possible outcomes.  Let's start with something simple.  List the outcomes I can get if I flip a coin twice.
7:00--Great, you should have gotten HH, HT, TH, TT.  Quick question.  Are HT and TH different results?  Should we count them as two different outcomes?  Why?
8:00--Ok, great.  4 outcomes.  Now you can make a probability distribution.  You start with a question.  "If I flip a coin twice, what is the chance I get heads?"  You want to start with a table that shows the possible outcomes and probabilities. 


9:00--Next, you translate that into a graph.  Often the graphs are "curves" but can also be bar graphs.


                                                                                                      (Image obtained here)
10:00--What questions do you have?
11:00--Let's look at another one.  This is based off of 10 coin flips.
                                                                     (Image located here)

12:00--Let's talk about this.  Why do you think the graph looks like this?  Is this common?  Can you compute, by hand, how many times you'd get only 1 head?  We'll come back to probability distributions later.
13:00--Ok, let's change directions.  What's the chance that I reach into a bag that has every letter in it, and I draw out an "H"?  What about if I replace it and try again.  What's the chance of drawing out an "I"?  Do you want to make these lists?  Can we figure out the probability without making the list?
14:00--Yes, it's 1/676.  I have a 1/676 chance (.15%) chance of randomly making the word "HI" when I draw the letters.  
15:00--Look at this graphic.  Read it carefully.  Think about it for a minute on your own.  (Show the π image.)
16:00--Talk about it with your friend.  Based on what you just observed about probability, do you think this graphic is true?  Why or why not?
18:00--It's a fascinating proposal!  If you are interested, this will be on my website so you can investigate further.  I also recommend researching the "Infinite Monkey Theorem" to help you understand what this image is suggesting as well as the probability of it happening.  (Note:  Teachers, the first GOOGLE link to infinite monkey theorem is to the winery.  You may want to offer your own links on your website to avoid any issues.  This is wikipedia, but has a good, basic intro to The Infinite Monkey Theorem.)  

How to use this as a full lesson?
I'd start a full lesson exactly as I did above.  I wouldn't feel the need to rush the kids and their answers or their work, though.  So this may take more than 20 minutes.

 As a 7th grade exploration.
Starting where we left off, with the "proposal" that all of "everything" can be found in π.

I'd print a page of the first ____ digits of π for the students.  I'd give each student a sheet and ask them to get a marker or highlighter.  I'd ask them to see if they could find the following sequences in the first ____ digits of π.
  • The two digit month they were born.
  • The two digit day they were born.
  • The two digit ending of the year they were born. 
  • The six digit birthdate made up of the month, day and year they were born.  Ex:  July 4, 1996 would be:  070496.
  • Their age.
  • Their height in inches.
  • Their height in centimeters.
This could take a VERY VERY long time.  Don't let it.  If they want to keep searching, let them do it at lunch, at home, etc.  Give them 10 minutes to explore.  Make a big deal out of it when kids find one!

Ask the kids to trade markers.  (A new color would be helpful.)  Then explain what ASCII is.  ASCII is an acronym for the American Standard Code for Information Interchange.  It is a set of digital codes widely used as a standard format in the transfer of text.  (google def.)  In other words, computers only talk in numbers, not in letters.  So ASCII is a programming language that translates letters and symbols to numeric codes.  Here's a conversion table:
 In this way, we can translate any word into strings of digits.  For example:
Sprigg:
S = 83
p = 112
r = 114
i = 105
g = 103
g = 103

So Sprigg could be translated to 83112114105103103  (Note: This is not entirely accurate, as coding systems need a way to know the difference between 83 and 831.)
However, I can now search π to see if this string of digits appear.   (It didn't appear in the first million digits.)  I did this by going to http://www.piday.org/million/ and then opening the find tool bar, and typing in my string of digits. 
 
I tried something easier, my nickname, Nat.  7897116 (Nope.)
I tried something easier, hi, as we explored before.  104105 (Nope.)

I was concerned that this wasn't working and tried pasting the digits in a word document to do the search.  Nope.  I checked by searching for a string I could see.  It was found.  So this method will work!  It was on page 6 before it found my 4 digit code of my birthday month and day.  

I really like this, even the failure part, because it illustrates to kids how difficult this probability will be.  If the translation to ASCII of "hi" can't be found in the first 9 pages of digits of π, what's the chance it will find, "the name of every person you will love, the date, the time" etc.?

I'd return to discuss the probability of this happening.

Then I'd throw out the Infinite Monkey Theorem (which I'm 99% certain inspired this graphic).  Ask the kids to discuss their thoughts and reactions to the theorem.  

Then share with them this quote, "The relevance of the theory is questionable—the probability of a monkey exactly typing a complete work such as Shakespeare's Hamlet is so tiny that the chance of it occurring during a period of time even a hundred thousand orders of magnitude longer than the age of the universe is extremely low (but not zero)."  (From wikipedia.)  

If that doesn't give all of us some perspective on the concept of infinity, not much will!

As a 10th grade exploration.
I would do the lesson outlined above, with a few changes.  
First, I'd still address the probability distribution in the mini lesson.  I'd continue from the mini lesson.  Rather than print pages of π, I'd get the kids to use technology.  Just as I outlined above, if they go to http://www.piday.org/million/ and search for the following sequences.
 

I'd ask them to see if they could find the following sequences in the first ____ digits of π.
  • The two digit month they were born.
  • The two digit day they were born.
  • The two digit ending of the year they were born. 
  • The six digit birthdate made up of the month, day and year they were born.  Ex:  July 4, 1996 would be:  070496.
  • Their age.
  • Their height in inches.
  • Their height in centimeters.
Give them 10 minutes to explore.  Make a big deal out of it when kids find one!  Let them try anything they want.  They may not find anything.  I'd try ages, shoe sizes, a combination of siblings' ages, etc. 

Given the image, the kids need to know what ASCII is.  Give them 3 or 4 minutes to use technology to search for what ASCII is and to find some examples.   (Info is above if you need it.)

Definitely take a minute to review their findings and clarify with them!

I'd then ask the kids to use the table above, or any tool they found in their research to translate their name to ASCII characters.  In this way, we can translate any word into strings of digits.  For example:
Sprigg:
S = 83
p = 112
r = 114
i = 105
g = 103
g = 103

So Sprigg could be translated to 83112114105103103  (Note: This is not entirely accurate, as coding systems need a way to know the difference between 83 and 831.)
However, students can now search π to see if this string of digits appear.   (It didn't appear in the first million digits.) 
 
I tried something easier, my nickname, Nat.  7897116 (Nope.)
I tried something easier, hi, as we explored before.  104105 (Nope.)

I was concerned that this wasn't working and tried pasting the digits in a word document to do the search.  Nope.  I checked by searching for a string I could see.  It was found.  So this method will work!  It was on page 6 before it found my 4 digit code of my birthday month and day.  

I really like this, even the failure part, because it illustrates to kids how difficult this probability will be.  If the translation to ASCII of "hi" can't be found in the first 9 pages of digits of π, what's the chance it will find, "the name of every person you will love, the date, the time" etc.?

I'd return to discuss the probability of this happening.

Then I'd throw out the Infinite Monkey Theorem (which I'm 99% certain inspired this graphic).  Ask the kids to discuss their thoughts and reactions to the theorem.  

Then share with them this quote, "The relevance of the theory is questionable—the probability of a monkey exactly typing a complete work such as Shakespeare's Hamlet is so tiny that the chance of it occurring during a period of time even a hundred thousand orders of magnitude longer than the age of the universe is extremely low (but not zero)."  (From wikipedia.)  

Ask your high school students to simply calculate the probability of the string of digits to form "hi" appearing in a row.  (104105)  That's 10^6 combinations!  1/1,000,000 chance!  Of course it doesn't appear in the first 1 million digits!  But what if those digits went on forever?   


How to use this as an assessment?

I don't feel that this is an appropriate assessment tool.  However, if you have just finished an in-depth exploration of probability at the high school level, you could definitely ask your students to respond to the graphic and back up their responses with mathematical thinking and research.  That would, to me, be a big project, and a take-home assignment at the very least!


Please feel free to use any of these ideas and modify them to meet your needs.  However, please acknowledge the original source of the items and my own lesson outlines.  ©NatalieRSprigg 2013